Every year for nearly seven decades, oil major BP Plc published its Statistical Review of World Energy, tallying up the world’s stocks and flows and combustion of hydrocarbons, as well as power generation data and even prices for metals critical to the energy transition, such as cobalt and lithium. Now the analysis has a new home: the UK-based Energy Institute, a membership organization for professionals in the energy industry, which took over publication from BP.
The report is always worth a deep dive, even for seasoned energy and climate analysts. Here are four highlights from the 2023 edition.
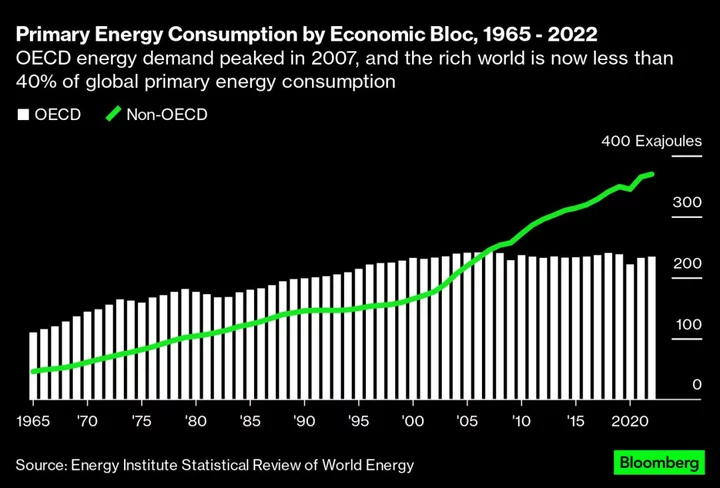
1. Energy demand is growing in non-OECD countries
Global primary energy consumption reached an all-time high last year, at more than 600 exajoules. That is double the world’s energy consumption in 1985, and four times the level in 1965, when the Statistical Review’s data begins.
Worldwide energy demand is increasing, but it is a split screen in terms of economies. For the high- and middle-income economies of the Organization for Economic Cooperation and Development, primary energy demand peaked 15 years ago — coincidentally the same year that demand in the rest of the world surpassed the OECD’s. Demand in OECD countries has actually declined by 3.4% in absolute terms since 2007, while it has grown almost unabated in the rest of the world over the same time.
In relative terms, the OECD’s role in global energy demand continues to decline, albeit slowly. In 2007, it was responsible for just under half of total energy consumption; today, it is less than 39%. The critical questions for energy’s future are how much that demand can decline in the long run and how quickly non-OECD countries can hit their own collective peak.
2. Oil is king. Or, coal is. (Or maybe gas)
Global demand for fossil fuels is also at an all-time high, and coal and gas individually are both in demand at record levels. And oil is, in one respect, the king of the fossil fuels: It was the most consumed fossil energy in 1965 and was the most consumed almost 70 years later in 2022.
But royal status depends on the time interval. If we look at the growth in consumption of these fuels (not their starting and ending levels from 1965 to 2022), we see how energy crises, economies and resource booms inform growth trends.
Since 1965, the increase in annual consumption has been nearly identical for oil and gas, with coal about 20% behind oil. But if we look from 1974 (the start of the first oil crisis), then consumption of gas and coal has increased more than consumption of oil. Run the same analysis from 2001 — the year of China’s accession to the World Trade Organization — and coal is king, with growth ahead of gas and almost double the growth of oil.
Finally, if we measure the increase in energy consumption from oil, coal and gas from 2011 to last year, gas has increased the most, followed by oil (about two-thirds of gas’s increase) and then coal (about one-third).
3. Ships beat pipes in the global gas trade
Natural gas has flowed between markets for decades, via both pipelines and seaborne shipments of liquefied natural gas. Pipelines drove the bulk of the inter-regional gas trade for years, but since 2020, LNG has taken the lead in total inter-regional trade volume. Considering the ongoing war in Ukraine and Russia’s restriction of its pipeline exports, and the booming trade in LNG now led by the US, this trend could continue for years to come.
4. Renewables besides hydropower follow the curve
Six decades ago, hydropower generated 95% of the world’s zero-emission electrons. By the turn of the century, that share had declined to 47.2% and nuclear power had (just barely) surpassed it, generating 48.6% of the total.
Those numbers don’t quite add up to 100%, clearly. In 2001 the combined generation from wind, solar, geothermal, biomass and other non-emitting power generation technologies made up 4.2% of the global pool of zero-emissions electricity. But those technologies (notably wind and especially solar) were at the beginning of an exponential increase in output. In 2020, non-hydro renewable generation surpassed nuclear; a year later, wind and solar generation alone passed nuclear. Last year, hydropower generated 4,334 terawatt-hours, while non-hydro renewables generated 4,204.
Year-on-year growth in non-hydro renewable generation from 2021 to 2022 was more than 500 terawatt-hours, which is more than all the electricity France used last year and very close to Germany’s usage.
With a record amount of solar set to be installed this year, it is only a matter of when, not if, non-hydro renewables become a bigger generation source than hydropower. In a dataset full of jagged lines and geopolitical dislocations, this one line is exceptionally smooth.
Nat Bullard is a senior contributor to BloombergNEF and writes the Sparklines column for Bloomberg Green. He advises early-stage climate technology companies and climate investors.