REDWOOD CITY, Calif.--(BUSINESS WIRE)--Aug 2, 2023--
Informatica (NYSE: INFA), an enterprise cloud data management leader, today announced financial results for its second quarter 2023, ended June 30, 2023.
This press release features multimedia. View the full release here: https://www.businesswire.com/news/home/20230802263241/en/
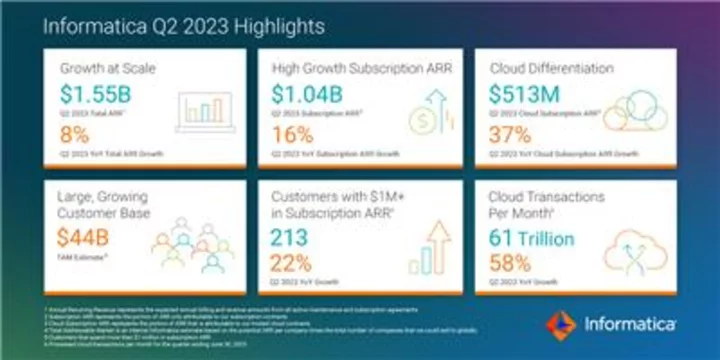
Informatica Q2 2023 Highlights (Source: Informatica)
“Q2 was another strong quarter for Informatica as we exceeded the high end of our guidance range for all our key performance metrics. Our intelligent data management cloud platform, IDMC, powered by our AI engine CLAIRE, uniquely positions us in the ‘AI and data-first world’ as we continue to deliver durable growth and profitability,” said Amit Walia, Chief Executive Officer at Informatica. “We are also excited to have closed on the acquisition of Privitar in July. We believe IDMC is becoming the most comprehensive and differentiated AI-powered platform at scale as we continue on our journey to be the enterprise standard for data management.”
Second Quarter 2023 Financial Highlights:
- GAAP Total Revenues increased 1% year-over-year to $376.0 million. Second quarter total revenues included a negative impact of approximately $2.2 million from foreign currency exchange rates (“FX”) year-over-year.
- GAAP Subscription Revenues increased 10% year-over-year to $227.6 million.
- Total ARR increased 8% year-over-year to $1.55 billion. Second quarter total ARR included a negative impact of approximately $1.9 million from FX year-over-year.
- GAAP Operating Loss of $5.4 million and Non-GAAP Operating Income of $87.5 million.
- GAAP Operating Cash Flow of $36.7 million.
- Adjusted Unlevered Free Cash Flow (after-tax) of $76.9 million. Cash paid for interest of $36.6 million.
A reconciliation of GAAP to non-GAAP financial measures has been provided in the tables included in this press release. An explanation of these measures is also included below under the heading “Non-GAAP Financial Measures.”
Second Quarter 2023 Business Highlights:
- Processed 60.7 trillion cloud transactions per month for the quarter ended June 30, 2023, compared to 38.5 trillion cloud transactions per month in the same quarter last year, an increase of 58% year-over-year.
- Reported 213 customers that spend more than $1 million in subscription ARR at the end of June 30, 2023, an increase of 22% year-over-year.
- Reported 1,940 customers that spend more than $100,000 in subscription ARR at the end of June 30, 2023, an increase of 8% year-over-year.
- Achieved a Cloud Subscription net retention rate (NRR) of 116% at the end of June 30, 2023.
Product Innovation:
- Announced CLAIRE GPT, a generative AI-powered capability that will deliver the advancements of a natural language-based interface to Informatica’s Intelligent Data Management Cloud (IDMC), dramatically simplifying and accelerating how enterprises consume, process, manage, and analyze data. Alongside CLAIRE GPT, Informatica will extend AI copilot capabilities to automate more data management tasks and processes and provide greater observability across data. CLAIRE GPT will be available in private preview in the third quarter 2023.
- Announced Cloud Data Integration for PowerCenter, a new cloud modernization capability to help customers accelerate modernizing on-premises PowerCenter assets to IDMC while significantly lowering migration time, costs, and risk. Available in the third quarter 2023.
- Launched Independent Software Vendor (ISV) Innovate, a new ecosystem partner program empowering ISV partners to create and integrate solutions exclusively for IDMC.
- Launched IDMC for environmental, social and governance (ESG) Sustainability, which enables end-to-end data lifecycle, including discovery, ingestion, integration of data and applications, quality improvements, a single view of ESG data, governance, privacy, and data sharing, helping enterprises satisfy ESG initiatives and regulations.
- Expanded partnership with Microsoft: launched IDMC as an Azure Native ISV service; integrated IDMC with Microsoft Fabric; launched Informatica’s Cloud Data Governance and Catalog natively on Microsoft Azure; and announced that Informatica's secure agent, Private Link, will be available on Azure in late 2023.
- Expanded partnership with Amazon: launched Amazon Web Services (AWS) Point of Delivery (PoD) in Japan to scale our market reach in Asia Pacific; launched Informatica's secure agent, Private Link, on AWS; and announced the availability of Cloud Data Integration-Free service for Amazon Redshift.
- Expanded partnership with Google: launched Master Data Management SaaS natively on Google Cloud Platform (GCP); and launched GCP PoD in EMEA.
- Expanded partnership with Snowflake: launched new integration capabilities with the public preview of Superpipe; added support for the private preview of Informatica’s Snowflake native application for enterprise data integration offering via Snowflake Partner Connect; and added support for Apache Iceberg tables.
- Expanded partnership with Databricks: added support for Databricks Unity catalog across data integration, data quality, and data catalog and governance; added support for Databricks Connect; and added support for Databricks SQL and Databricks delta lake for Informatica’s PowerCenter to IDMC migration program.
- Expanded partnership with ZS, a global consulting firm: embedded IDMC with ZS’s cloud-native ZAIDYN platform for life sciences.
Industry Recognition:
- Ranked #1 in IDC's "Worldwide Data Integration and Intelligence Software Market Shares, 2022: Controlling Data Amid Uncertainty Report" for the seventh consecutive year. Recognized in five submarkets: Data Ingestion & Transformation, Data Quality, Data Intelligence, Master Data Management and Dynamic Data Movement.
- Named a Leader in The Forrester Wave™ Master Data Management, Q2 2023 Report for the fifth consecutive time.
- Named a Champion in the Bloor Research Market Update for Data Quality 2023.
- Named a Leader in the Nucleus Research 2023 iPaaS Technology Value Matrix.
Corporate Updates:
- Completed the acquisition of Privitar, a leader in data access management and privacy software, on July 12, 2023. The acquisition expands Informatica's IDMC offerings, providing a richer set of capabilities to support new mission-critical workloads and use cases across data governance, data integration, catalog and privacy, data quality and master data management.
- Rescheduled Investor Day for December 5, 2023, in San Francisco, CA.
Third Quarter and Full-Year 2023 Financial Outlook
The Company provides the financial guidance below based on current market conditions and expectations and it is subject to various important cautionary factors described below. Guidance includes the impact from macroeconomic conditions and expected foreign exchange headwinds versus the prior year comparable periods. The acquisition of Privitar is expected to be immaterial to revenue and earnings in 2023.
Based on information available as of August 2, 2023, guidance for the third quarter 2023 is as follows:
Third Quarter 2023 Ending September 30, 2023:
- GAAP Total Revenues are expected to be in the range of $395 million to $405 million, representing approximately 8% year-over-year growth at the midpoint of the range.
- Subscription ARR is expected to be in the range of $1,050 million to $1,060 million, representing approximately 13% year-over-year growth at the midpoint of the range.
- Cloud Subscription ARR is expected to be in the range of $537 million to $543 million, representing approximately 35% year-over-year growth at the midpoint of the range.
- Non-GAAP Operating Income is expected to be in the range of $110 million to $120 million, representing approximately 37% year-over-year growth at the midpoint of the range.
Based on information available as of August 2, 2023, guidance for the full-year 2023 is as follows:
Full-Year 2023 Ending December 31, 2023:
- GAAP Total Revenues are expected to be in the range of $1,570 million to $1,590 million, representing approximately 5% year-over-year growth at the midpoint of the range.
- Total ARR is expected to be in the range of $1,585 million to $1,615 million, representing approximately 5% year-over-year growth at the midpoint of the range.
- Subscription ARR is expected to be in the range of $1,098 million to $1,118 million, representing approximately 11% year-over-year growth at the midpoint of the range.
- Cloud Subscription ARR is expected to be in the range of $604 million to $614 million, representing approximately 35% year-over-year growth at the midpoint of the range.
- Raising Non-GAAP Operating Income from $400 million to $420 million to a range of $420 million to $440 million, representing approximately 23% year-over-year growth at the midpoint of the range.
- Raising Adjusted Unlevered Free Cash Flow (after-tax) from $340 million to $360 million to a range of $370 million to $390 million, representing approximately 32% year-over-year growth at the midpoint of the range.
The Company is assuming constant FX rates for the year based on the rates at the start of the full-year 2023 planning period. For reference purposes, the assumed FX rates for our top four currencies in full-year 2023 are as follows:
Currency | Planned Rate |
EUR/$ | 1.07 |
GBP/$ | 1.20 |
$/CAD | 1.35 |
$/JPY | 132 |
Using the foreign exchange rate assumptions noted above, the Company has incorporated the following FX impacts into 2023 guidance:
Q3 2023 | Full-Year 2023 | |
Total Revenues | — | ~$1m negative impact y/y |
Total ARR | ~$1m negative impact y/y | ~$11m negative impact y/y |
Subscription ARR | ~$1m negative impact y/y | ~$8m negative impact y/y |
Cloud Subscription ARR | — | ~$3m negative impact y/y |
In addition to the above guidance, the Company is also providing third quarter and full-year 2023 cash paid for interest estimates for modeling purposes. For the third quarter 2023, we estimate cash paid for interest to be approximately $39 million. For the full-year 2023, we estimate cash paid for interest to be approximately $149 million.
In addition to the above guidance, the Company is also providing a third quarter and full-year 2023 weighted-average number of basic and diluted share estimates for modeling purposes. For the third quarter 2023, we expect basic weighted-average shares outstanding to be approximately 289 million shares and diluted weighted-average shares outstanding to be approximately 294 million shares. For the full-year 2023, we expect basic weighted-average shares outstanding to be approximately 288 million shares and diluted weighted-average shares outstanding to be approximately 293 million shares.
Reconciliation of non-GAAP operating income and adjusted unlevered free cash flow after-tax guidance to the most directly comparable GAAP measures is not available without unreasonable effort, as certain items cannot be reasonably predicted because of their high variability, complexity, and low visibility. In particular, the measures and effects of our stock-based compensation expense specific to our equity compensation awards and employer payroll tax-related items on employee stock transactions are directly impacted by the timing of employee stock transactions and unpredictable fluctuations in our stock price, which we expect to have a significant impact on our future GAAP financial results.
Webcast and Conference Call
A conference call to discuss Informatica’s second quarter 2023 financial results and financial outlook for the third quarter and full-year 2023 is scheduled for 2:00 p.m. Pacific Time today. To participate, please dial 1-833-470-1428 from the U.S. or 1-404-975-4839 from international locations. The conference passcode is 237691. A live webcast of the conference call will be available on the Investor Relations section of Informatica’s website at investors.informatica.com where presentation materials will also be posted prior to the conference call. A replay will be available online approximately two hours following the live call for a period of 30 days.
Forward-Looking Statements
This press release and the related conference call and webcast contain forward-looking statements within the meaning of Section 27A of the Securities Act of 1933, as amended, and Section 21E of the Securities Exchange Act of 1934, as amended. These statements may relate to, but are not limited to, expectations of future operating results or financial performance, including expectations regarding achieving profitability and our GAAP and non-GAAP guidance for the third quarter and 2023 fiscal year, the effect of foreign currency exchange rates, the effect of macroeconomic conditions, management’s plans, priorities, initiatives, and strategies, and management's estimates and expectations regarding growth of our business, the potential benefits realized by customers from our cloud modernization programs, market, and partnerships. Forward-looking statements are inherently subject to risks and uncertainties, some of which cannot be predicted or quantified. In some cases, you can identify forward-looking statements because they contain words such as “anticipate,” “believe,” “contemplate,” “continue,” “could,” “estimate,” “expect,” “intend,” “may,” “plan,” “potential,” “predict,” “project,” “should,” “target,” “toward,” “will,” or “would,” or the negative of these words or other similar terms or expressions. You should not put undue reliance on any forward-looking statements. Forward-looking statements should not be read as a guarantee of future performance or results and will not necessarily be accurate indications of the times at, or by, which such performance or results will be achieved, if at all.
Forward-looking statements are based on information available at the time those statements are made and are based on current expectations, estimates, forecasts, and projections as well as the beliefs and assumptions of management as of that time with respect to future events. These statements are subject to risks and uncertainties, many of which involve factors or circumstances that are beyond our control, that could cause actual performance or results to differ materially from those expressed in or suggested by the forward-looking statements. In light of these risks and uncertainties, the forward-looking events and circumstances discussed in this press release may not occur and actual results could differ materially from those anticipated or implied in the forward-looking statements. These risks, uncertainties, assumptions, and other factors include, but are not limited to, those related to our business and financial performance, the effects of adverse global macroeconomic conditions and geopolitical uncertainty, the effects of public health crises on our business, results of operations, and financial condition, our ability to attract and retain customers, our ability to develop new products and services and enhance existing products and services, our ability to respond rapidly to emerging technology trends, our ability to execute on our business strategy, including our strategy related to the Informatica IDMC platform and key partnerships, our ability to increase and predict customer consumption of our platform, our ability to compete effectively, and our ability to manage growth.
Further information on these and additional risks, uncertainties, and other factors that could cause actual outcomes and results to differ materially from those included in or contemplated by the forward-looking statements contained in this release are included under the caption “Risk Factors” and elsewhere in our Annual Report on Form 10-K that was filed for the fiscal year ended December 31, 2022, and other filings and reports we make with the Securities and Exchange Commission from time to time, including our Quarterly Report on Form 10-Q that will be filed for the second quarter ended June 30, 2023. All forward-looking statements contained herein are based on information available to us as of the date hereof and we do not assume any obligation to update these statements as a result of new information or future events.
Non-GAAP Financial Measures and Key Business Metrics
We review several operating and financial metrics, including the following unaudited non-GAAP financial measures and key business metrics to evaluate our business, measure our performance, identify trends affecting our business, formulate business plans, and make strategic decisions:
Non-GAAP Financial Measures
In addition to our results determined in accordance with U.S. generally accepted accounting principles (GAAP), we believe the following non-GAAP measures are useful in evaluating our operating performance. We use the following non-GAAP financial measures to evaluate our ongoing operations and for internal planning and forecasting purposes. We believe that these non-GAAP financial measures, when taken collectively, may be helpful to investors because they provide consistency and comparability with past financial performance. However, non-GAAP financial measures are presented for supplemental informational purposes only, have limitations as an analytical tool, and should not be considered in isolation or as a substitute for financial information presented in accordance with GAAP. In addition, other companies, including companies in our industry, may calculate similarly titled non-GAAP measures differently or may use other measures to evaluate their performance, all of which could reduce the usefulness of our non-GAAP financial measures as tools for comparison. A reconciliation is provided below for our non-GAAP financial measures to the most directly comparable financial measures stated in accordance with GAAP. Investors are encouraged to review the related GAAP financial measures and the reconciliation of these non-GAAP financial measures to their most directly comparable GAAP financial measures, and not to rely on any single financial measure to evaluate our business.
Non-GAAP Income from Operations and Non-GAAP Net Income exclude the effect of stock-based compensation expense-related charges, amortization of acquired intangibles, equity compensation related payments, expenses associated with acquisitions, and strategic investments, and are adjusted for income tax effects. We believe the presentation of operating results that exclude these non-cash or non-recurring items provides useful supplemental information to investors and facilitates the analysis of our operating results and comparison of operating results across reporting periods.
Adjusted EBITDA represents GAAP net loss as adjusted for income tax benefit (expense), interest income, interest expense, loss on debt refinancing, other income (expense), stock-based compensation, amortization of intangibles, equity compensation related payments, restructuring, acquisition and other charges, and depreciation. Equity compensation-related payments are related to the repurchase of employee stock options. We believe adjusted EBITDA is an important metric for understanding our business to assess our relative profitability adjusted for balance sheet debt levels.
Adjusted Unlevered Free Cash Flow (after-tax) represents operating cash flow less purchases of property and equipment and is adjusted for interest payments, equity compensation payments, restructuring costs (including payments for impaired leases), and executive severance. We believe this measure provides useful supplemental information to investors because it is an indicator of our liquidity over the long term needed to maintain and grow our core business operations. We also provide actual and forecast cash interest expense to aid in the calculation of adjusted free cash flow (after-tax).
Key Business Metrics
Annual Recurring Revenue (ARR) represents the expected annual billing amounts from all active maintenance and subscription agreements. ARR is calculated based on the contract Monthly Recurring Revenue (MRR) multiplied by 12. MRR is calculated based on the accounting adjusted total contract value divided by the number of months of the agreement based on the start and end dates of each contracted line item. The aggregate ARR calculated at the end of each reported period represents the value of all contracts that are active as of the end of the period, including those contracts that have expired but are still under negotiation for renewal. We typically allow for a grace period of up to 6 months past the original contract expiration quarter during which we engage in the renewal process before we report the contract as lost /inactive. This grace-period ARR amount has been less than 2% of the reported ARR in each period presented. If there is an actual cancellation of an ARR contract, we remove that ARR value at that time. We believe ARR is an important metric for understanding our business since it tracks the annualized cash value collected over a 12-month period for all our recurring contracts, irrespective of whether it is a maintenance contract on a perpetual license, a ratable cloud contract, or an on-premise term-based subscription license.
Maintenance Annual Recurring Revenue represents the portion of ARR only attributable to our maintenance contracts. We believe that Maintenance ARR is a helpful metric for understanding our business since it represents the approximate annualized cash value collected over a 12-month period for all our maintenance contracts. Maintenance ARR includes maintenance contracts supporting our on-premise perpetual licenses. Maintenance ARR should be viewed independently of maintenance revenue and deferred revenue related to our maintenance contracts and is not intended to be combined with or to replace either of those items.
Subscription Annual Recurring Revenue represents the portion of ARR only attributable to our subscription contracts. We believe that Subscription ARR is a helpful metric for understanding our business since it represents the approximate annualized cash value collected over a 12-month period for all our recurring subscription contracts. Subscription ARR excludes maintenance contracts on our perpetual licenses to provide information regarding the period-to-period performance and overall size and scale of our subscription business as we continue to focus our efforts on subscription-based licensing. Subscription ARR should be viewed independently of subscription revenue and deferred revenue related to our subscription contracts and is not intended to be combined with or to replace either of those items.
Cloud Subscription Annual Recurring Revenue represents the portion of ARR that is attributable to our hosted cloud contracts. We believe that Cloud Subscription ARR is a helpful metric for understanding our business since it represents the approximate annualized cash value collected over a 12-month period for all our recurring Cloud contracts. Cloud Subscription ARR is a subset of our overall Subscription ARR, and by providing this breakdown of Cloud Subscription ARR, it provides visibility on the size and growth rate of our Cloud Subscription ARR within our overall Subscription ARR. Cloud Subscription ARR should be viewed independently of subscription revenue and deferred revenue related to our subscription contracts and is not intended to be combined with or to replace either of those items.
Subscription Net Retention Rate(NRR) compares the contract value for Subscription ARR from the same set of customers at the end of a period compared to the prior year. We treat divisions, segments, or subsidiaries inside companies as separate customers. To calculate our Subscription NRR for a particular period, we first establish the Subscription ARR value at the end of the prior-year period. We subsequently measure the Subscription ARR value at the end of the current period from the same cohort of customers. The net retention rate is then calculated by dividing the aggregate Subscription ARR in the current period by the prior-year period. An increase in the Subscription NRR occurs as a result of price increases on existing contracts, higher consumption of existing products, and sales of additional new subscription products to existing customers exceeding losses from subscription contracts due to cancellations. We believe Subscription NRR is an important metric for understanding our business since it measures the rate at which we are able to sell additional products into our subscription customer base.
Cloud Subscription Net Retention Rate compares the contract value for Cloud Subscription ARR from the same set of customers at the end of a period compared to the prior year. We treat divisions, segments or subsidiaries inside companies as separate customers. To calculate our Cloud Subscription NRR for a particular period, we first establish the Cloud Subscription ARR value at the end of the prior year period. We subsequently measure the Cloud Subscription ARR value at the end of the current period from the same cohort of customers. Cloud Subscription NRR is then calculated by dividing the aggregate Cloud Subscription ARR in the current period by the prior year period. An increase in the Cloud Subscription NRR occurs as a result of price increases on existing contracts, higher consumption of existing products, and sales of additional new subscription products to existing customers exceeding losses from subscription contracts due to price decreases, usage decreases and cancellations. We believe Cloud Subscription NRR is an important metric for understanding our business since it measures the rate at which we are able to sell additional products into our cloud subscription customer base.
About Informatica
Informatica (NYSE: INFA), an Enterprise Cloud Data Management leader, brings data to life by empowering businesses to realize the transformative power of their most critical assets. We have created a new category of software, the Informatica Intelligent Data Management Cloud™ (IDMC). IDMC is an end-to-end data management platform, powered by CLAIRE ® AI, that connects, manages and unifies data across any multi-cloud or hybrid system, democratizing data and enabling enterprises to modernize and advance their business strategies. Customers in more than 100 countries, including 85 of the Fortune 100, rely on Informatica to drive data-led digital transformation. Informatica. Where data comes to life.
INFORMATICA INC. | ||||||||||||
CONSOLIDATED STATEMENTS OF OPERATIONS | ||||||||||||
(in thousands, except per share data) | ||||||||||||
(unaudited) | ||||||||||||
Three Months Ended June 30, | Six Months Ended June 30, | |||||||||||
2023 | 2022 | 2023 | 2022 | |||||||||
Revenues: | ||||||||||||
Subscriptions | $ | 227,589 | $ | 207,043 | $ | 441,511 | $ | 404,790 | ||||
Perpetual license | 13 | 2,300 | 819 | 4,972 | ||||||||
Software revenue | 227,602 | 209,343 | 442,330 | 409,762 | ||||||||
Maintenance and professional services | 148,386 | 162,696 | 299,089 | 324,624 | ||||||||
Total revenues | 375,988 | 372,039 | 741,419 | 734,386 | ||||||||
Cost of revenues: | ||||||||||||
Subscriptions | 38,626 | 25,177 | 74,310 | 49,881 | ||||||||
Perpetual license | 213 | 176 | 393 | 329 | ||||||||
Software costs | 38,839 | 25,353 | 74,703 | 50,210 | ||||||||
Maintenance and professional services | 43,864 | 52,120 | 87,023 | 101,925 | ||||||||
Amortization of acquired technology | 2,889 | 8,936 | 5,763 | 18,073 | ||||||||
Total cost of revenues | 85,592 | 86,409 | 167,489 | 170,208 | ||||||||
Gross profit | 290,396 | 285,630 | 573,930 | 564,178 | ||||||||
Operating expenses: | ||||||||||||
Research and development | 87,707 | 84,064 | 169,746 | 159,187 | ||||||||
Sales and marketing | 134,500 | 143,597 | 263,038 | 272,549 | ||||||||
General and administrative | 38,756 | 31,632 | 80,116 | 61,206 | ||||||||
Amortization of intangible assets | 34,348 | 38,459 | 68,639 | 77,120 | ||||||||
Restructuring | 471 | — | 27,724 | — | ||||||||
Total operating expenses | 295,782 | 297,752 | 609,263 | 570,062 | ||||||||
Loss from operations | (5,386 | ) | (12,122 | ) | (35,333 | ) | (5,884 | ) | ||||
Interest income | 9,920 | 1,129 | 17,503 | 1,495 | ||||||||
Interest expense | (37,466 | ) | (16,560 | ) | (72,517 | ) | (29,385 | ) | ||||
Other income, net | 2,531 | 3,837 | 3,161 | 8,057 | ||||||||
Loss before income taxes | (30,401 | ) | (23,716 | ) | (87,186 | ) | (25,717 | ) | ||||
Income tax expense | 122,065 | 6,790 | 181,634 | 7,975 | ||||||||
Net loss | $ | (152,466 | ) | $ | (30,506 | ) | $ | (268,820 | ) | $ | (33,692 | ) |
Net loss per share attributable to Class A and Class B-1 common stockholders: | ||||||||||||
Basic | $ | (0.53 | ) | $ | (0.11 | ) | $ | (0.94 | ) | $ | (0.12 | ) |
Diluted | $ | (0.53 | ) | $ | (0.11 | ) | $ | (0.94 | ) | $ | (0.12 | ) |
Weighted-average shares used in computing net loss per share: | ||||||||||||
Basic | 287,109 | 280,417 | 286,004 | 279,599 | ||||||||
Diluted | 287,109 | 280,417 | 286,004 | 279,599 |
INFORMATICA INC. | ||||
CONSOLIDATED BALANCE SHEETS | ||||
(in thousands, except par value data) | ||||
June 30, | December 31, | |||
2023 | 2022 | |||
(unaudited) | ||||
Assets | ||||
Current assets: | ||||
Cash and cash equivalents | $ | 632,803 | $ | 497,879 |
Short-term investments | 188,693 | 218,256 | ||
Accounts receivable, net of allowances of $4,736 and $4,608, respectively | 299,909 | 454,759 | ||
Contract assets, net | 85,805 | 95,221 | ||
Prepaid expenses and other current assets | 121,321 | 132,638 | ||
Total current assets | 1,328,531 | 1,398,753 | ||
Property and equipment, net | 155,335 | 160,574 | ||
Operating lease right-of-use-assets | 59,897 | 67,735 | ||
Goodwill | 2,349,881 | 2,337,036 | ||
Customer relationships intangible asset, net | 732,541 | 794,898 | ||
Other intangible assets, net | 23,598 | 33,094 | ||
Deferred tax assets | 19,765 | 13,076 | ||
Other assets | 158,299 | 165,733 | ||
Total assets | $ | 4,827,847 | $ | 4,970,899 |
Liabilities and Stockholders’ Equity | ||||
Current liabilities: | ||||
Accounts payable | $ | 15,594 | $ | 38,002 |
Accrued liabilities | 42,553 | 58,844 | ||
Accrued compensation and related expenses | 95,741 | 150,118 | ||
Current operating lease liabilities | 16,285 | 17,514 | ||
Current portion of long-term debt | 18,750 | 18,750 | ||
Income taxes payable | 119,534 | 3,758 | ||
Contract liabilities | 645,249 | 676,470 | ||
Total current liabilities | 953,706 | 963,456 | ||
Long-term operating lease liabilities | 48,214 | 55,178 | ||
Long-term contract liabilities | 18,146 | 23,007 | ||
Long-term debt, net | 1,813,835 | 1,821,760 | ||
Deferred tax liabilities | 30,431 | 18,604 | ||
Long-term income taxes payable | 37,668 | 30,601 | ||
Other liabilities | 3,749 | 3,932 | ||
Total liabilities | 2,905,749 | 2,916,538 | ||
Stockholders’ equity: | ||||
Class A common stock; $0.01 par value per share; 2,000,000 and 2,000,000 shares authorized as of June 30, 2023 and December 31, 2022, respectively; 243,948 and 239,749 shares issued and outstanding as of June 30, 2023 and December 31, 2022, respectively | 2,440 | 2,398 | ||
Class B-1 common stock; $0.01 par value per share; 200,000 and 200,000 shares authorized as of June 30, 2023 and December 31, 2022 respectively; 44,050 and 44,050 shares issued and outstanding as of June 30, 2023 and December 31, 2022, respectively | 440 | 440 | ||
Class B-2 common stock; $0.00001 par value per share, 200,000 and 200,000 shares authorized as of June 30, 2023 and December 31, 2022, respectively; 44,050 and 44,050 shares issued and outstanding as of June 30, 2023 and December 31, 2022, respectively | — | — | ||
Additional paid-in-capital | 3,400,575 | 3,282,383 | ||
Accumulated other comprehensive loss | (29,336 | ) | (47,671 | ) |
Accumulated deficit | (1,452,021 | ) | (1,183,189 | ) |
Total stockholders’ equity | 1,922,098 | 2,054,361 | ||
Total liabilities and stockholders’ equity | $ | 4,827,847 | $ | 4,970,899 |
INFORMATICA INC. | ||||||||||||
CONSOLIDATED STATEMENTS OF CASH FLOWS | ||||||||||||
(in thousands) | ||||||||||||
(unaudited) | ||||||||||||
Three Months Ended June 30, | Six Months Ended June 30, | |||||||||||
2023 | 2022 | 2023 | 2022 | |||||||||
Operating activities: | ||||||||||||
Net loss | $ | (152,466 | ) | $ | (30,506 | ) | $ | (268,820 | ) | $ | (33,692 | ) |
Adjustments to reconcile net loss to net cash provided by operating activities: | ||||||||||||
Depreciation and amortization | 4,273 | 5,643 | 8,471 | 11,370 | ||||||||
Non-cash operating lease costs | 3,674 | 4,140 | 9,024 | 8,717 | ||||||||
Stock-based compensation | 55,208 | 34,558 | 105,550 | 63,833 | ||||||||
Deferred income taxes | (7,479 | ) | (51,202 | ) | 3,998 | (57,347 | ) | |||||
Amortization of intangible assets and acquired technology | 37,237 | 47,395 | 74,402 | 95,193 | ||||||||
Amortization of debt issuance costs | 857 | 918 | 1,704 | 1,837 | ||||||||
Amortization of investment discount, net of premium | (900 | ) | — | (1,751 | ) | — | ||||||
Changes in operating assets and liabilities: | ||||||||||||
Accounts receivable | (38,332 | ) | (37,563 | ) | 159,247 | 140,154 | ||||||
Prepaid expenses and other assets | 16,098 | 8,176 | 27,081 | 3,691 | ||||||||
Accounts payable and accrued liabilities | 14,749 | 16,289 | (103,327 | ) | (110,050 | ) | ||||||
Income taxes payable | 106,566 | 32,844 | 128,750 | 14,863 | ||||||||
Contract liabilities | (2,780 | ) | (14,759 | ) | (37,742 | ) | (52,481 | ) | ||||
Net cash provided by operating activities | 36,705 | 15,933 | 106,587 | 86,088 | ||||||||
Investing activities: | ||||||||||||
Purchases of property and equipment | (1,891 | ) | (356 | ) | (3,115 | ) | (1,000 | ) | ||||
Purchases of investments | (117,628 | ) | (31,442 | ) | (147,925 | ) | (48,668 | ) | ||||
Maturities of investments | 71,200 | 23,187 | 151,700 | 47,301 | ||||||||
Sales of investments | 23,798 | — | 23,798 | — | ||||||||
Net cash (used in) / provided by investing activities | (24,521 | ) | (8,611 | ) | 24,458 | (2,367 | ) | |||||
Financing activities: | ||||||||||||
Payment of debt | (4,688 | ) | (4,688 | ) | (9,376 | ) | (4,688 | ) | ||||
Proceeds from issuance of common stock under employee stock purchase plan | — | — | 16,131 | 13,644 | ||||||||
Payments of offering costs | — | (1,580 | ) | — | (2,085 | ) | ||||||
Payments for dividends related to Class B-2 shares | — | — | (12 | ) | (24 | ) | ||||||
Payments for taxes related to net share settlement of equity awards | (11,100 | ) | — | (11,100 | ) | — | ||||||
Net activity from derivatives with an other-than-insignificant financing element | — | (2,548 | ) | — | (7,134 | ) | ||||||
Proceeds from issuance of shares under equity plans | 4,172 | 7,768 | 7,653 | 12,474 | ||||||||
Net cash (used in) / provided by financing activities | (11,616 | ) | (1,048 | ) | 3,296 | 12,187 | ||||||
Effect of foreign exchange rate changes on cash and cash equivalents | (672 | ) | (8,374 | ) | 583 | (10,803 | ) | |||||
Net (decrease) / increase in cash and cash equivalents | (104 | ) | (2,100 | ) | 134,924 | 85,105 | ||||||
Cash and cash equivalents at beginning of period | 632,907 | 545,301 | 497,879 | 458,096 | ||||||||
Cash and cash equivalents at end of period | $ | 632,803 | $ | 543,201 | $ | 632,803 | $ | 543,201 | ||||
Supplemental disclosures: | ||||||||||||
Cash paid for interest | $ | 36,580 | $ | 16,803 | $ | 71,062 | $ | 30,481 | ||||
Cash paid for income taxes, net of refunds | $ | 22,979 | $ | 25,149 | $ | 48,886 | $ | 50,459 |
INFORMATICA INC. | ||||||||||||
NON-GAAP FINANCIAL MEASURES AND KEY BUSINESS METRICS | ||||||||||||
(in thousands, except per share data) | ||||||||||||
(unaudited) | ||||||||||||
RECONCILIATIONS OF GAAP TO NON-GAAP | ||||||||||||
Reconciliation of GAAP net loss to Non-GAAP net income | ||||||||||||
Three Months Ended June 30, | Six Months Ended June 30, | |||||||||||
2023 | 2022 | 2023 | 2022 | |||||||||
(in thousands) | (in thousands) | |||||||||||
GAAP net loss | $ | (152,466 | ) | $ | (30,506 | ) | $ | (268,820 | ) | $ | (33,692 | ) |
Stock-based compensation | 55,208 | 34,558 | 105,550 | 63,833 | ||||||||
Amortization of intangibles | 37,237 | 47,395 | 74,402 | 95,193 | ||||||||
Equity compensation | — | 45 | — | 128 | ||||||||
Restructuring | 471 | — | 27,724 | — | ||||||||
Executive severance | — | 33 | — | 66 | ||||||||
Income tax effect | 107,687 | (6,622 | ) | 153,922 | (22,730 | ) | ||||||
Non-GAAP net income | $ | 48,137 | $ | 44,903 | $ | 92,778 | $ | 102,798 | ||||
Net loss per share: | ||||||||||||
Net loss per share—basic | $ | (0.53 | ) | $ | (0.11 | ) | $ | (0.94 | ) | $ | (0.12 | ) |
Net loss per share—diluted | $ | (0.53 | ) | $ | (0.11 | ) | $ | (0.94 | ) | $ | (0.12 | ) |
Non-GAAP net income per share—basic | $ | 0.17 | $ | 0.16 | $ | 0.32 | $ | 0.37 | ||||
Non-GAAP net income per share—diluted | $ | 0.17 | $ | 0.16 | $ | 0.32 | $ | 0.36 | ||||
Share count (in thousands): | ||||||||||||
Weighted-average shares used in computing Net loss per share—basic | 287,109 | 280,417 | 286,004 | 279,599 | ||||||||
Weighted-average shares used in computing Net loss per share—diluted | 287,109 | 280,417 | 286,004 | 279,599 | ||||||||
Weighted-average shares used in computing Non-GAAP net income per share—basic | 287,109 | 280,417 | 286,004 | 279,599 | ||||||||
Weighted-average shares used in computing Non-GAAP net income per share—diluted | 290,980 | 284,028 | 289,812 | 284,335 |
Reconciliation of GAAP loss from operations to Non-GAAP income from operations | ||||||||||||
Three Months Ended June 30, | Six Months Ended June 30, | |||||||||||
2023 | 2022 | 2023 | 2022 | |||||||||
(in thousands) | (in thousands) | |||||||||||
GAAP loss from operations | $ | (5,386 | ) | $ | (12,122 | ) | $ | (35,333 | ) | $ | (5,884 | ) |
Stock-based compensation | 55,208 | 34,558 | 105,550 | 63,833 | ||||||||
Amortization of intangibles | 37,237 | 47,395 | 74,402 | 95,193 | ||||||||
Equity compensation | — | 45 | — | 128 | ||||||||
Restructuring | 471 | — | 27,724 | — | ||||||||
Non-GAAP income from operations | $ | 87,530 | $ | 69,876 | $ | 172,343 | $ | 153,270 |
INFORMATICA INC. | |||||||||||||||
NON-GAAP FINANCIAL MEASURES AND KEY BUSINESS METRICS | |||||||||||||||
Adjusted EBITDA Reconciliation | |||||||||||||||
Three Months Ended June 30, | Six Months Ended June 30, | Trailing Twelve Months ("TTM") Ended June 30, | |||||||||||||
2023 | 2022 | 2023 | 2022 | 2023 | |||||||||||
(in thousands) | (in thousands) | (in thousands) | |||||||||||||
GAAP net loss | $ | (152,466 | ) | $ | (30,506 | ) | $ | (268,820 | ) | $ | (33,692 | ) | $ | (288,803 | ) |
Income tax expense | 122,065 | 6,790 | 181,634 | 7,975 | 193,137 | ||||||||||
Interest income | (9,920 | ) | (1,129 | ) | (17,503 | ) | (1,495 | ) | (25,232 | ) | |||||
Interest expense | 37,466 | 16,560 | 72,517 | 29,385 | 121,152 | ||||||||||
Other income, net | (2,531 | ) | (3,837 | ) | (3,161 | ) | (8,057 | ) | (4,100 | ) | |||||
Stock-based compensation | 55,208 | 34,558 | 105,550 | 63,833 | 177,579 | ||||||||||
Amortization of intangibles | 37,237 | 47,395 | 74,402 | 95,193 | 168,034 | ||||||||||
Equity compensation | — | 45 | — | 128 | 204 | ||||||||||
Restructuring | 471 | — | 27,724 | — | 27,724 | ||||||||||
Depreciation | 4,208 | 5,469 | 8,408 | 11,194 | 18,221 | ||||||||||
Adjusted EBITDA | $ | 91,738 | $ | 75,345 | $ | 180,751 | $ | 164,464 | $ | 387,916 |
Adjusted Unlevered Free Cash Flows | ||||||||
Three Months Ended June 30, | Six Months Ended June 30, | |||||||
2023 | 2022 | 2023 | 2022 | |||||
(in thousands, except percentages) | (in thousands, except percentages) | |||||||
Total GAAP Revenue | $ | 375,988 | $ | 372,039 | $ | 741,419 | $ | 734,386 |
Net cash provided by operating activities | $ | 36,705 | $ | 15,933 | $ | 106,587 | $ | 86,088 |
Less: Purchases of property, plant, and equipment | (1,891 | ) | (356 | ) | (3,115 | ) | (1,000 | ) |
Add: Equity compensation payments | 53 | 165 | 121 | 345 | ||||
Add: Executive severance | — | — | — | 3,919 | ||||
Add: Restructuring costs | 5,476 | 186 | 25,620 | 393 | ||||
Adjusted Free Cash Flow (after-tax) (1) | $ | 40,343 | $ | 15,928 | $ | 129,213 | $ | 89,745 |
Add: Cash paid for interest | 36,580 | 16,803 | 71,062 | 30,481 | ||||
Adjusted Unlevered Free Cash Flows (after-tax) (1) | $ | 76,923 | $ | 32,731 | $ | 200,275 | $ | 120,226 |
Adjusted Free Cash Flow (after-tax) margin (1) | 11 | % | 4 | % | 17 | % | 12 | % |
Adjusted Unlevered Free Cash Flows (after-tax) margin (1) | 20 | % | 9 | % | 27 | % | 16 | % |
(1) Includes cash tax payments of $23.0 million and $25.1 million for the three months ended June 30, 2023 and 2022, respectively and $48.9 million and $50.5 million for the six months ended June 30, 2023 and 2022, respectively. |
Key Business Metrics | ||||
June 30, | ||||
2023 | 2022 | |||
(in thousands, except percentages) | ||||
Cloud Subscription Annual Recurring Revenue | $ | 512,615 | $ | 373,303 |
Self-managed Subscription Annual Recurring Revenue | 529,723 | 522,815 | ||
Subscription Annual Recurring Revenue | 1,042,338 | 896,118 | ||
Maintenance Annual Recurring Revenue on Perpetual Licenses | 505,186 | 540,708 | ||
Total Annual Recurring Revenue | $ | 1,547,524 | $ | 1,436,826 |
Subscription Net Retention Rate | 107 | % | 113 | % |
Cloud Subscription Net Retention Rate | 116 | % | 116 | % |
INFORMATICA INC. | ||||
SUPPLEMENTAL INFORMATION | ||||
Additional Business Metrics | ||||
June 30, | ||||
2023 | 2022 | |||
Maintenance Renewal Rate | 94 | % | 95 | % |
Subscription Renewal Rate | 92 | % | 94 | % |
Customers that spend more than $1 million in Subscription Annual Recurring Revenue (1) | 213 | 175 | ||
Customers that spend more than $100,000 in Subscription Annual Recurring Revenue (2) | 1,940 | 1,791 | ||
Cloud transactions processed per month in trillions (3) | 60.7 | 38.5 | ||
(1) Total number of customers that spend more than $1 million in Subscription Annual Recurring Revenue. | ||||
| (2) Total number of customers that spend more than $100,000 in Subscription Annual Recurring Revenue. | ||||
| (3) Total number of cloud transactions processed on our platform per month in trillions, which measures data processed. |
Net Debt Reconciliation | ||||
June 30, | December 31 | |||
2023 | 2022 | |||
(in millions) | ||||
Dollar Term Loan | $ | 1,852 | $ | 1,861 |
Less: Cash, cash equivalents, and short-term investments | (821 | ) | (716 | ) |
Total net debt | $ | 1,031 | $ | 1,145 |
View source version on businesswire.com:https://www.businesswire.com/news/home/20230802263241/en/
CONTACT: Investor Relations:
Victoria Hyde-Dunn
vhydedunn@informatica.comPublic Relations:
prteam@informatica.com
KEYWORD: CALIFORNIA UNITED STATES NORTH AMERICA
INDUSTRY KEYWORD: NETWORKS INTERNET DATA MANAGEMENT TECHNOLOGY SOFTWARE
SOURCE: Informatica
Copyright Business Wire 2023.
PUB: 08/02/2023 04:05 PM/DISC: 08/02/2023 04:06 PM
http://www.businesswire.com/news/home/20230802263241/en