RICHMOND, Va.--(BUSINESS WIRE)--May 17, 2023--
Bowlero Corp. (NYSE: BOWL) (“Bowlero” or the “Company”), the world’s largest owner and operator of bowling centers, today provided financial results for the third quarter of the 2023 fiscal year, which ended on April 2, 2023. Bowlero announced record revenue of $316 million, driven by continued strong event performance and solid increases in league and walk-in-retail revenue. Event Revenue 3 grew 49% ($20 million) vs. the prior year's quarter and 83% ($27 million) vs. the comparable pre-pandemic period. Total revenue grew by 22% on a year-over-year basis and 54% compared to pre-pandemic performance. Same-store revenue rose by 17% year-over-year and 30% relative to the pre-pandemic period.
This press release features multimedia. View the full release here: https://www.businesswire.com/news/home/20230517005746/en/
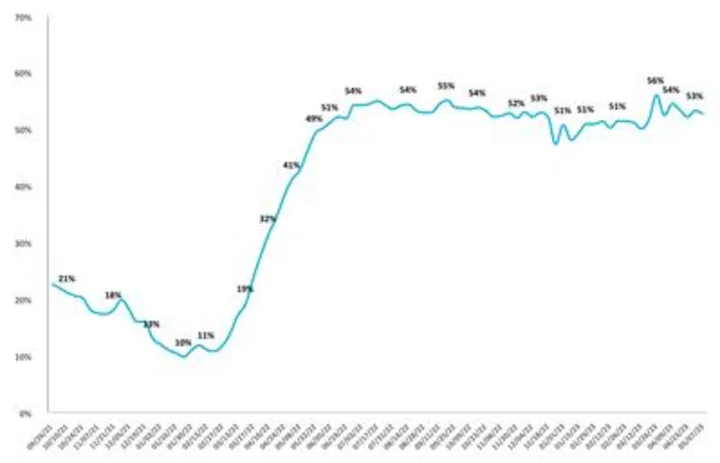
Bowling Center Trailing 13-week Revenue Growth Trend (Graphic: Business Wire)
"The Company’s third quarter performance set new records for Revenue and Adjusted EBITDA while maintaining extremely healthy margins. In our seasonally most significant quarter, the Company delivered fantastic results driven by continued same-store revenue growth,” said Thomas Shannon, Founder and Chief Executive Officer. "Adjusted EBITDA increased its quarterly record by $19 million vs. the previous record set in Q3 FY22. We remain very excited for MoneyBowl™. Our proprietary gamification app has now been rolled out to 64 centers. MoneyBowl™ has the potential to revolutionize bowling today similar to how experiential bowling transformed the bowling industry in the 2000s."
Third-Quarter 2023 Operating Results
Revenue during the quarter, totaling $316 million, was up 22% on a year-over-year basis, and up 54% relative to pre-pandemic. Same-store revenue increased 17% year-over-year, demonstrating the Company's ability to continue to drive organic growth.
Net loss for the quarter was $32 million, after giving effect to $87 million of non-cash expenses related to the increase in the fair value of earnouts. Net Loss per share for the quarter was $(0.22). In the prior year, Net loss for the quarter was $18 million, driven primarily by the $67 million of non-cash expenses related to the increase in fair value of the earnouts. Adjusted for the non-cash expenses, Adjusted Net Income in the quarter was $55 million, which increased $3 million or 6% vs. the prior year's Adjusted Net Income. Adjusted Earnings per diluted share for the quarter was $0.26.
Adjusted EBITDA for the quarter was $128 million, up 18% year-over-year and 89% relative to pre-pandemic performance. The Company was able to materially expand the EBITDA margin compared to pre-pandemic as a result of QMS, Bowlero's proprietary tech-enabled financial performance optimization tool, a relentless focus on efficient execution, and operating leverage from higher revenue generation in the quarter.
Brett Parker, President and Chief Financial Officer of Bowlero Corp., said, "We had a strong quarter and continue to prove out Bowlero's potential as we achieve new heights. We set records for both Revenue and Adjusted EBITDA generated in a quarter. Revenue for the quarter exceeded the previous record (set Q2 FY23) by an astounding $42 million. Meanwhile, we undertook several steps to de-risk the balance sheet and reduce the fully diluted share count."
Financial Position
As of April 2, 2023, cash, cash equivalents, and restricted cash totaled $161 million and total debt was $915 million, resulting in net debt of $754 million. At the end of the third quarter of 2023, Bowlero’s Net Leverage Ratio was 2.1x TTM Adjusted EBITDA. For the third quarter of 2023, Net Cash provided by operating Activities was $93 million, and Net Cash generated from Adjusted Operating Activities was $118 million when adjusted for the $25 million in interest expense paid in cash.
Share Repurchase Program
During the quarter, the Company repurchased 371 thousand shares of Class A common stock at an average price of $15.01. As of April 2, 2023, the total Class A and Class B shares outstanding are 173.3 million after the first tranche of earn-out shares were earned on March 2, when the stock traded over $15 for the 10 th time in a 20 day span.
Subsequent to the quarter-end, Bowlero has repurchased an additional 2 million shares of Class A Common stock at an average price of $14.04 through May 15, 2023 bringing the total shares acquired under the program to 7 million and the average purchase price to $11.85. In addition to the repurchase of common stock, the Company has retired approximately 32% of the outstanding Series A preferred stock for $81 million as of April 25, 2023. On May 16, 2023, the Board authorized an increase to the share repurchase program to $200 million.
Bowling Center Trailing 13-week Revenue Growth Trend 4
[Please see the Bowling Center Trailing 13-week Revenue Growth Trend Chart]
Investor Webcast Information
Listeners may access an investor webcast hosted by Bowlero. The webcast and results presentation will be accessible at 4:30 PM ET on May 17, 2023 in the Events & Presentations section of the Bowlero Investor Relations website at https://ir.bowlerocorp.com/overview/default.aspx.
About Bowlero Corp.
Bowlero Corp. is the worldwide leader in bowling entertainment. With more than 325 bowling centers across North America, Bowlero Corp. serves nearly 30 million guests each year through a family of brands that includes Bowlero and AMF. Bowlero Corp. is also home to the Professional Bowlers Association, which boasts thousands of members and millions of fans across the globe. For more information on Bowlero Corp., please visit BowleroCorp.com.
Forward Looking Statements
Some of the statements contained in this press release are forward-looking statements within the meaning of Section 27A of the Securities Act of 1933, as amended, and Section 21E of the Securities Exchange Act of 1934, as amended. These forward-looking statements are generally identified by the use of words such as "anticipate," "believe," "could," "estimate," "expect," "intend," "may," "plan," "potential," "predict," "project," "should," "target," "will," "would" and, in each case, their negative or other various or comparable terminology and include preliminary results. These forward-looking statements reflect our views with respect to future events as of the date of this release and are based on our management’s current expectations, estimates, forecasts, projections, assumptions, beliefs and information. Although management believes that the expectations reflected in these forward-looking statements are reasonable, it can give no assurance that these expectations will prove to have been correct. All such forward-looking statements are subject to risks and uncertainties, many of which are outside of our control, and could cause future events or results to be materially different from those stated or implied in this document. It is not possible to predict or identify all such risks. These risks include, but are not limited to: the impact of COVID-19 or other adverse public health developments on our business; our ability to grow and manage growth profitably, maintain relationships with customers, compete within our industry and retain our key employees; changes in consumer preferences and buying patterns; the possibility that we may be adversely affected by other economic, business, and/or competitive factors; the risk that the market for our entertainment offerings may not develop on the timeframe or in the manner that we currently anticipate; general economic conditions and uncertainties affecting markets in which we operate and economic volatility that could adversely impact our business, including the COVID-19 pandemic and other factors described under the section titled “Risk Factors” in the Company's Annual Report on Form 10-K filed with the U.S. Securities and Exchange Commission (the “SEC”) by the Company on September 15, 2022, as well as other filings that the Company will make, or has made, with the SEC, such as Quarterly Reports on Form 10-Q and Current Reports on Form 8-K. These factors should not be construed as exhaustive and should be read in conjunction with the other cautionary statements that are included in this press release and in other filings. We expressly disclaim any obligation to publicly update or review any forward-looking statements, whether as a result of new information, future developments or otherwise, except as required by applicable law.
GAAP Financial Information
Bowlero Corp. | ||||
Condensed Consolidated Balance Sheets | ||||
(Amounts in thousands, except share and per share amounts) | ||||
(Unaudited) | ||||
April 2, 2023 | July 3, 2022 | |||
Assets | ||||
Current assets: | ||||
Cash and cash equivalents | $ | 150,670 | $ | 132,236 |
Restricted cash | 10,374 | — | ||
Accounts and notes receivable, net of allowance for doubtful accounts of $592 and $504, respectively | 6,157 | 5,227 | ||
Inventories, net | 11,848 | 10,310 | ||
Prepaid expenses and other current assets | 19,649 | 12,732 | ||
Assets held-for-sale | 2,069 | 8,789 | ||
Total current assets | 200,767 | 169,294 | ||
Property and equipment, net | 663,937 | 534,721 | ||
Internal use software, net | 16,434 | 11,423 | ||
Property and equipment under capital leases, net | 252,379 | 262,703 | ||
Intangible assets, net | 91,982 | 92,593 | ||
Goodwill | 750,230 | 742,669 | ||
Other assets | 38,409 | 41,022 | ||
Total assets | $ | 2,014,138 | $ | 1,854,425 |
Liabilities, Temporary Equity and Stockholders’ Equity (Deficit) | ||||
Current liabilities: | ||||
Accounts payable | $ | 46,601 | $ | 38,217 |
Accrued expenses | 83,774 | 62,854 | ||
Current maturities of long-term debt | 5,569 | 4,966 | ||
Other current liabilities | 10,946 | 13,123 | ||
Total current liabilities | 146,890 | 119,160 | ||
Long-term debt, net | 897,404 | 865,090 | ||
Long-term obligations under capital leases | 393,890 | 397,603 | ||
Earnout liability | 185,361 | 210,952 | ||
Other long-term liabilities | 80,004 | 54,418 | ||
Deferred income tax liabilities | 15,771 | 14,882 | ||
Total liabilities | 1,719,320 | 1,662,105 | ||
Commitments and Contingencies (Note 10) | ||||
Temporary Equity | ||||
Series A preferred stock | 206,376 | 206,002 | ||
April 2, 2023 | July 3, 2022 | |||
Stockholders’ Equity (Deficit) | ||||
Class A common stock | $ | 11 | $ | 11 |
Class B common stock | 6 | 6 | ||
Additional paid-in capital | 519,093 | 335,015 | ||
Treasury stock, at cost | (53,530 | ) | (34,557 | ) |
Accumulated deficit | (377,023 | ) | (312,851 | ) |
Accumulated other comprehensive loss | (115 | ) | (1,306 | ) |
Total stockholders’ equity (deficit) | 88,442 | (13,682 | ) | |
Total liabilities, temporary equity and stockholders’ equity (deficit) | $ | 2,014,138 | $ | 1,854,425 |
Bowlero Corp. | ||||||||||||
Condensed Consolidated Statements of Operations | ||||||||||||
(Amounts in thousands) | ||||||||||||
(Unaudited) | ||||||||||||
Three Months Ended | Nine Months Ended | |||||||||||
April 2, | March 27, | April 2, | March 27, | |||||||||
Revenues | $ | 315,725 | $ | 257,820 | $ | 819,370 | $ | 643,988 | ||||
Costs of revenues | 189,304 | 156,491 | 534,212 | 424,742 | ||||||||
Gross profit | 126,421 | 101,329 | 285,158 | 219,246 | ||||||||
Operating (income) expenses: | ||||||||||||
Selling, general and administrative expenses | 35,891 | 30,315 | 102,837 | 145,013 | ||||||||
Asset impairment | 489 | — | 573 | — | ||||||||
Gain on sale of assets | (192 | ) | (1,601 | ) | (2,170 | ) | (1,755 | ) | ||||
Other operating expense | 649 | 1,899 | 2,625 | 5,708 | ||||||||
Total operating expense | 36,837 | 30,613 | 103,865 | 148,966 | ||||||||
Operating profit | 89,584 | 70,716 | 181,293 | 70,280 | ||||||||
Other expenses: | ||||||||||||
Interest expense, net | 29,117 | 22,293 | 80,066 | 69,101 | ||||||||
Change in fair value of earnout liability | 87,222 | 45,778 | 158,758 | 23,236 | ||||||||
Change in fair value of warrant liability | — | 20,678 | — | 20,748 | ||||||||
Other expense | 5,986 | 161 | 5,356 | 161 | ||||||||
Total other expense | 122,325 | 88,910 | 244,180 | 113,246 | ||||||||
Loss before income tax (benefit) expense | (32,741 | ) | (18,194 | ) | (62,887 | ) | (42,966 | ) | ||||
Income tax (benefit) expense | (668 | ) | (207 | ) | 1,285 | (6,089 | ) | |||||
Net loss | (32,073 | ) | (17,987 | ) | (64,172 | ) | (36,877 | ) | ||||
Series A preferred stock dividends | (4,401 | ) | (2,818 | ) | (10,004 | ) | (7,290 | ) | ||||
Net loss attributable to common stockholders | $ | (36,474 | ) | $ | (20,805 | ) | $ | (74,176 | ) | $ | (44,167 | ) |
Net loss per share attributable to Class A and B common stockholders | ||||||||||||
Basic & Diluted | $ | (0.22 | ) | $ | (0.13 | ) | $ | (0.45 | ) | $ | (0.29 | ) |
Weighted-average shares used in computing net loss per share attributable to common stockholders | ||||||||||||
Basic & Diluted | 165,698,500 | 162,590,921 | 163,676,194 | 152,731,385 |
Bowlero Corp. | ||||||||
Condensed Consolidated Statements of Cash Flows | ||||||||
(Amounts in thousands) | ||||||||
(Unaudited) | ||||||||
Three Months Ended | Nine Months Ended | |||||||
April 2, | March 27, | April 2, | March 27, | |||||
Net cash provided by operating activities | $ | 92,923 | $ | 83,576 | $ | 208,802 | $ | 142,861 |
Net cash used in investing activities | (24,944 | ) | (17,896 | ) | (187,949 | ) | (178,744 | ) |
Net cash provided by (used in) financing activities | 2,838 | (8,461 | ) | 7,964 | 21,752 | |||
Effect of exchange rate changes on cash | 418 | 99 | (9 | ) | 15 | |||
Net increase (decrease) in cash, cash equivalents and restricted cash | 71,235 | 57,318 | 28,808 | (14,116 | ) | |||
Cash, cash equivalents and restricted cash at beginning of period | 89,809 | 115,659 | 132,236 | 187,093 | ||||
Cash, cash equivalents and restricted cash at end of period | $ | 161,044 | $ | 172,977 | $ | 161,044 | $ | 172,977 |
GAAP to non-GAAP Reconciliations
Adjusted EBITDA Reconciliation | |||
Three Months Ended | |||
(in thousands) | April 2, 2023 | March 27, 2022 | March 31, 2019 |
Consolidated | |||
Revenue | $315,725 | $257,820 | $205,023 |
Net (loss) income - GAAP | (32,073) | (17,987) | 27,432 |
Adjustments: | |||
Interest expense | 29,117 | 22,293 | 15,468 |
Income tax (benefit) expense | (668) | (207) | (291) |
Depreciation, amortization and impairment charges | 29,933 | 29,986 | 20,490 |
Share-based compensation | 4,207 | 3,020 | 847 |
Closed center EBITDA (1) | 480 | 611 | 588 |
Foreign currency exchange loss (gain) | 328 | (90) | 5 |
Asset disposition (gain) loss | (192) | (1,601) | 2,045 |
Transactional and other advisory costs (2) | 8,726 | 4,757 | 127 |
Charges attributed to new initiatives (3) | 40 | 43 | 270 |
Extraordinary unusual non-recurring losses (gains) (4) | 468 | 929 | 369 |
Changes in the value of earnouts and warrants (5) | 87,222 | 66,617 | — |
Adjusted EBITDA | $127,588 | $108,371 | $67,350 |
- The closed center adjustment is to remove EBITDA for closed centers. Closed centers are those centers that are closed for a variety of reasons, including permanent closure, newly acquired or built centers prior to opening, centers closed for renovation or rebranding and conversion. Closed centers do not include centers closed in compliance with local, state and federal government restrictions due to COVID-19. If a center is not open on the last day of the reporting period, it will be considered closed for that reporting period. If the center is closed on the first day of the reporting period for permanent closure, the center will be considered closed for that reporting period.
- The adjustment for transaction costs and other advisory costs is to remove charges incurred in connection with any transaction, including mergers, acquisitions, refinancing, amendment or modification to indebtedness, dispositions and costs in connection with an initial public offering, in each case, regardless of whether consummated.
- The adjustment for charges is to remove charges attributed to new initiatives include charges with the undertaking and/or implementation of new initiatives, business optimization activities, cost savings initiatives, cost rationalization programs, operating expense reductions and/or synergies and/or similar initiatives and/or programs (including in connection with any integration, restructuring or transition, any reconstruction, decommissioning, recommissioning, or reconfiguration of fixed assets for alternative uses, any office or facility opening and/or pre-opening), including any inventory optimization program and/or any curtailment, any business optimization charge, any restructuring charge (including any charges relating to any tax restructuring), any charge relating to the closure or consolidation of any office or facility (including but not limited to rent terminations, moving costs and legal costs), any systems implementation charge, any severance charge, any one time compensation charge, any charge relating to entry into a new market, any charge relating to any strategic initiative or contract, any charge relating to any entry into new markets and contracts, any lease run-off charge, any charge associated with improvements to information technology (IT) or accounting functions, losses related to temporary decreases in work volume and expenses related to maintaining underutilized personnel, any charge relating to a new contract, any consulting charge and/or any corporate development charge; provided, that, in this case of any such charge, the results of any such action relating to such charge are projected by in good faith to be achieved with 24 months of undertaking.
- The adjustment for extraordinary unusual non-recurring gains or losses is to remove extraordinary gains and losses, which include any gain or charge from any extraordinary item as determined in good faith by the Company and/or any non-recurring or unusual item as determined in good faith by the Company and/or any charge associated with and/or payment of any legal settlement, fine, judgment or order.
- The adjustment for changes in the value of earnouts and warrants is to remove the impact of the revaluation of the earnouts and warrants. As a result of the Company's de-SPAC transaction, the Company recorded liabilities for earnouts and warrants. Changes in the fair value of the earnout and warrant liabilities are recognized in the statement of operations. Decreases in the liability will have a favorable impact on the income statement and increases in the liability will have an unfavorable impact.
Trailing twelve month Adjusted EBITDA Reconciliation | ||||||
(in thousands) | December 26, | March 27, | July 3, | October 2, | January 1, | April 2, |
Consolidated | ||||||
TTM Revenue | $657,483 | $803,091 | $911,705 | $960,987 | $1,029,182 | $1,087,087 |
TTM Net loss | $(55,442) | $(50,338) | $(29,934) | $(79,032) | $(43,143) | $(57,229) |
Adjustments: | ||||||
Interest expense | 92,239 | 92,229 | 94,460 | 95,102 | 98,601 | 105,425 |
Income tax (benefit) expense | (7,147) | (7,457) | (690) | 5,983 | 7,145 | 6,684 |
Depreciation, amortization and impairment charges | 95,363 | 102,359 | 108,505 | 112,015 | 115,658 | 115,605 |
Share-based compensation | 44,975 | 47,169 | 50,236 | 53,083 | 14,564 | 15,751 |
Closed center EBITDA (1) | 3,374 | 3,179 | 1,480 | 1,439 | 1,809 | 1,678 |
Foreign currency exchange (gain) loss | 126 | (68) | 5 | (101) | (369) | 49 |
Asset disposition (gain) loss | (58) | (1,723) | (4,109) | (4,234) | (5,934) | (4,525) |
Transactional and other advisory costs (2) | 40,474 | 43,379 | 38,140 | 37,537 | 14,268 | 18,237 |
Charges attributed to new initiatives (3) | 489 | 396 | 362 | 266 | 241 | 238 |
Extraordinary unusual non-recurring losses (4) | 3,374 | 3,009 | 5,131 | 7,233 | 3,390 | 2,929 |
Changes in the value of earnouts and warrants and settlement costs (5) | (22,472) | 44,145 | 52,789 | 93,549 | 146,797 | 167,402 |
TTM Adjusted EBITDA | $195,295 | $276,279 | $316,375 | $322,840 | $353,027 | $372,244 |
- The closed center adjustment is to remove EBITDA for closed centers. Closed centers are those centers that are closed for a variety of reasons, including permanent closure, newly acquired or built centers prior to opening, centers closed for renovation or rebranding and conversion. Closed centers do not include centers closed in compliance with local, state and federal government restrictions due to COVID-19. If a center is not open on the last day of the reporting period, it will be considered closed for that reporting period. If the center is closed on the first day of the reporting period for permanent closure, the center will be considered closed for that reporting period.
- The adjustment for transaction costs and other advisory costs is to remove charges incurred in connection with any transaction, including mergers, acquisitions, refinancing, amendment or modification to indebtedness, dispositions and costs in connection with an initial public offering, in each case, regardless of whether consummated.
- The adjustment for charges is to remove charges attributed to new initiatives include charges with the undertaking and/or implementation of new initiatives, business optimization activities, cost savings initiatives, cost rationalization programs, operating expense reductions and/or synergies and/or similar initiatives and/or programs (including in connection with any integration, restructuring or transition, any reconstruction, decommissioning, recommissioning, or reconfiguration of fixed assets for alternative uses, any office or facility opening and/or pre-opening), including any inventory optimization program and/or any curtailment, any business optimization charge, any restructuring charge (including any charges relating to any tax restructuring), any charge relating to the closure or consolidation of any office or facility (including but not limited to rent terminations, moving costs and legal costs), any systems implementation charge, any severance charge, any one time compensation charge, any charge relating to entry into a new market, any charge relating to any strategic initiative or contract, any charge relating to any entry into new markets and contracts, any lease run-off charge, any charge associated with improvements to information technology (IT) or accounting functions, losses related to temporary decreases in work volume and expenses related to maintaining underutilized personnel, any charge relating to a new contract, any consulting charge and/or any corporate development charge; provided, that, in this case of any such charge, the results of any such action relating to such charge are projected by in good faith to be achieved with 24 months of undertaking.
- The adjustment for extraordinary unusual non-recurring gains or losses is to remove extraordinary gains and losses, which include any gain or charge from any extraordinary item as determined in good faith by the Company and/or any non-recurring or unusual item as determined in good faith by the Company and/or any charge associated with and/or payment of any legal settlement, fine, judgment or order.
- The adjustment for changes in the value of earnouts and warrants is to remove the impact of the revaluation of the earnouts and warrants. As a result of the Company's de-SPAC transaction, the Company recorded liabilities for earnouts and warrants. Changes in the fair value of the earnout and warrant liabilities are recognized in the statement of operations. Decreases in the liability will have a favorable impact on the income statement and increases in the liability will have an unfavorable impact. The adjustment also includes realized costs associated with the settlement of warrants during past reporting periods.
Adjusted Net Income Reconciliation | ||
Three Months Ended | ||
(in thousands) | April 2, 2023 | March 27, 2022 |
Net loss | $(32,073) | $(17,987) |
Change in fair value of earnouts and warrants | 87,222 | 66,617 |
Share-based compensation | — | — |
Transactional and other advisory costs | — | 3,353 |
Adjusted Net Income | $55,149 | $51,983 |
Adjusted Net Income Attributable to all Common Stockholders Reconciliation | ||
Three Months Ended | ||
(in thousands) | April 2, 2023 | March 27, 2022 |
Net Loss attributable to all common stockholders | $(36,474) | $(20,805) |
Change in fair value of earnouts and warrants | 87,222 | 66,617 |
Share-based compensation | — | — |
Transactional and other advisory costs | — | 3,353 |
Adjusted Net Income attributable to all common stockholders | $50,748 | $49,165 |
Adjusted earnings per share attributable to all common stockholders | ||
Basic | $0.31 | $0.30 |
Diluted | $0.26 | $0.27 |
Weighted average total common shares outstanding (in millions) | ||
Basic | 165.7 | 162.6 |
Diluted | 193.9 | 183.6 |
Net Operating Activities Reconciliation | ||
Three Months Ended | ||
(in thousands) | April 2, 2023 | March 27, 2022 |
Net Cash Provided by Operating Activities - GAAP | $92,923 | $83,576 |
Cash Paid for Interest | 25,142 | 19,476 |
Adjusted Cash from Operating Activities | $118,065 | $103,052 |
Non-GAAP Financial Measures
To provide investors with information in addition to our results as determined under Generally Accepted Accounting Principles (“GAAP”), we disclose Adjusted Net Income, Adjusted Cash from Operating Activities, Adjusted EBITDA, trailing twelve month Adjusted EBITDA, and Adjusted Net Income Attributable to all Common Stockholders as “non-GAAP measures” that management believes provide useful information to investors because each measure assists both investors and management in analyzing and benchmarking the performance and value of our business. Accordingly, management believes that these measurements are useful for comparing general operating performance from period to period, and management relies on these measures for planning and forecasting of future periods. Additionally, these measures allow management to compare our results with those of other companies that have different financing and capital structures. These measures are not financial measures calculated in accordance with GAAP and should not be considered as a substitute for revenue, net income, net cash provided (used) by operating activities or any other operating performance or liquidity measure calculated in accordance with GAAP, and may not be comparable to a similarly titled measure reported by other companies.
Adjusted Net Income represents Net income (loss) before non-cash expenses or income related to changes in the value of earnouts and warrants. Adjusted Cash from Operating Activities represents net cash provided by operating activities before cash interest expense. Adjusted EBITDA represents Net Income (Loss) before Interest, Income Taxes, Depreciation and Amortization, Share-based Compensation, EBITDA from Closed Centers, Foreign Currency Exchange Loss (Gain), Asset Disposition Loss (Gain), Transactional and other advisory costs, charges attributed to new initiatives, Extraordinary unusual non-recurring gains or losses and changes in the value of earnouts and warrants and settlement costs. Trailing twelve month Adjusted EBITDA represents Adjusted EBITDA over the most recent twelve month period.
The Company considers Adjusted Net Income as an important financial measure because it provides an indicator of performance that is not affected by fluctuations in certain costs or other items. However, this measure has limitations as an analytical tool, and you should not consider it in isolation or as a substitute for analysis of our results as reported under GAAP. Some of these limitations are that it does not reflect every cash expenditure and is not adjusted for all non-cash income or expense items that are reflected in our statements of cash flows.
The Company considers Adjusted Cash from Operating Activities as an important financial measure because it provides an indicator of cash flow that is not affected by how the Company finances its operations. However, this measure has limitations as an analytical tool, and you should not consider it in isolation or as a substitute for analysis of cash generation as reported under GAAP.
The Company considers Adjusted EBITDA as an important financial measure because it provides a financial measure of the quality of the Company’s earnings. Other companies may calculate Adjusted EBITDA differently than we do, which might limit its usefulness as a comparative measure. Adjusted EBITDA is used by management in addition to and in conjunction with the results presented in accordance with GAAP. Additionally, we believe trailing twelve month Adjusted EBITDA provides the current run-rate for trending purposes, rather than annualizing the respective quarters, as the Company’s business is seasonal, with the second and third fiscal quarters being higher than the first and last quarters. We have presented Adjusted EBITDA solely as a supplemental disclosure because we believe it allows for a more complete analysis of results of operations and assists investors and analysts in comparing our operating performance across reporting periods on a consistent basis by excluding items that we do not believe are indicative of our core operating performance. Adjusted EBITDA has limitations as an analytical tool, and you should not consider it in isolation or as a substitute for analysis of our results as reported under GAAP. Some of these limitations are that Adjusted EBITDA and trailing twelve month Adjusted EBITDA:
- do not reflect every expenditure, future requirements for capital expenditures or contractual commitments;
- do not reflect changes in our working capital needs;
- do not reflect the interest expense, or the amounts necessary to service interest or principal payments, on our outstanding debt;
- do not reflect income tax (benefit) expense, and because the payment of taxes is part of our operations, tax expense is a necessary element of our costs and ability to operate;
- do not reflect non-cash equity compensation, which will remain a key element of our overall equity based compensation package; and
- do not reflect the impact of earnings or charges resulting from matters we consider not to be indicative of our ongoing operations.
__________________________________
1 The pre-pandemic comparable period for the quarter ended April 2, 2023 is the quarter ended on March 31, 2019.
2 Same-store revenue are measured by comparing revenues for centers open for the entire duration of both the current and comparable measurement periods.
3 Event revenue represent revenue from corporate and other special events and group parties booked in advanced and held at the bowling centers.
4 Revenue growth is calculated as the growth in Bowling Center Revenue compared to the comparable week during the pre-pandemic 52-week period beginning March 2019 and ending February 2020. Total Bowling Center Revenue (i) excludes media-related revenue and (ii) closed bowling centers from both current period and pre-pandemic and prior year periods and (iii) includes new bowling centers that have opened since March 2020. For weeks ending between (i) September 26, 2021 - December 26, 2021, (ii) March 6, 2022 - January 1, 2023, and (iii) March 12, 2023 - April 30, 2023, the percentages above are calculated by comparing each week to the comparable week in 2019. For weeks ending between (i) January 2, 2022 - February 27, 2022 and (ii) January 8, 2023 and March 5, 2023, the percentages above are calculated by comparing each week to the comparable week in 2020. Total Bowling Center Revenue for each date is the 13-week rolling average of weekly Total Bowling Center Revenue. We use the 13-week rolling average because the revenue performance in individual weeks can be positively or negatively impacted by timing shift of holiday/sporting events, holidays moving to weekends, and extreme weather events. Data for all weeks following the close of the quarter ended on April 2, 2023 are preliminary and have not been audited or reviewed and are forward-looking statements based solely on information available to us as of the date of this announcement.
View source version on businesswire.com:https://www.businesswire.com/news/home/20230517005746/en/
CONTACT: For Media:
Bowlero Corp. Public Relations
PR@BowleroCorp.com
For Investors:
Bowlero Corp. Public Relations
IRSupport@BowleroCorp.com
Ashley DeSimone
Ashley.DeSimone@icrinc.com
KEYWORD: VIRGINIA UNITED STATES NORTH AMERICA
INDUSTRY KEYWORD: SPORTS BOWLING
SOURCE: Bowlero Corp.
Copyright Business Wire 2023.
PUB: 05/17/2023 04:05 PM/DISC: 05/17/2023 04:05 PM
http://www.businesswire.com/news/home/20230517005746/en