EAST AURORA, N.Y.--(BUSINESS WIRE)--Aug 3, 2023--
Astronics Corporation (Nasdaq: ATRO) (“Astronics” or the “Company”), a leading supplier of advanced technologies and products to the global aerospace, defense and other mission critical industries, today reported financial results for the three and six months ended July 1, 2023.
This press release features multimedia. View the full release here: https://www.businesswire.com/news/home/20230803576443/en/
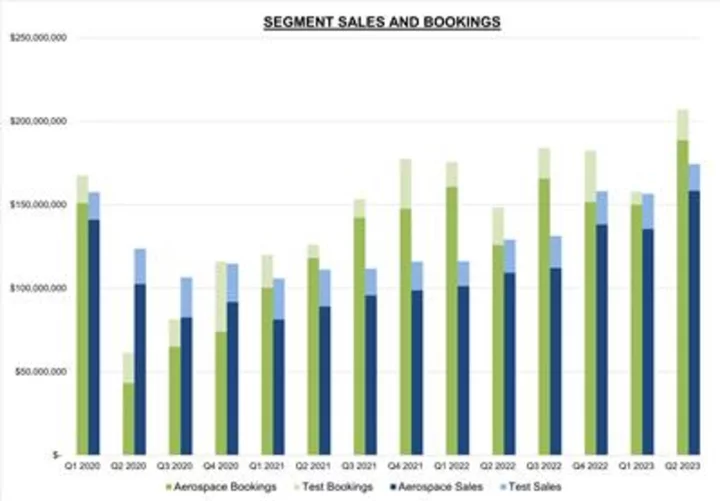
ATRO Segment Sales and Bookings Chart (Graphic: Business Wire)
Peter J. Gundermann, Chairman, President and Chief Executive Officer, commented, “Our second quarter results show the momentum in our business as the commercial aerospace industry advances its recovery. Demand for our products is high and our supply chain continues to improve. Revenue of $175 million was a significant step up sequentially and year-over-year, and bookings of $207 million were at pre-pandemic levels. We believe we are set for a strong second half of 2023 and, if current trends continue, an even stronger 2024.”
_____________________________ |
| 1Adjusted EBITDA is a Non-GAAP Performance Measure. Please see the attached table for a reconciliation of adjusted EBITDA to GAAP net loss. |
Second Quarter Results
Three Months Ended | Six Months Ended | |||||||||||||||
($ in thousands) | July 1, 2023 | July 2, 2022 | % Change | July 1, 2023 | July 2, 2022 | % Change | ||||||||||
Sales | $ | 174,454 | $ | 129,127 | 35.1 | % | $ | 330,992 | $ | 245,303 | 34.9 | % | ||||
Income (Loss) from Operations | $ | 2,396 | $ | (8,396 | ) | 128.5 | % | $ | 26 | $ | (12,563 | ) | 100.2 | % | ||
Operating Margin % | 1.4 | % | (6.5 | )% | — | % | (5.1 | )% | ||||||||
Net Gain on Sale of Business | $ | — | $ | — | $ | (3,427 | ) | $ | (11,284 | ) | ||||||
Net Loss | $ | (11,999 | ) | $ | (11,010 | ) | (9.0 | )% | $ | (16,414 | ) | $ | (14,111 | ) | (16.3 | )% |
Net Loss % | (6.9 | )% | (8.5 | )% | (5.0 | )% | (5.8 | )% | ||||||||
*Adjusted EBITDA | $ | 15,844 | $ | 2,081 | 661.4 | % | $ | 21,922 | $ | 3,030 | 623.5 | % | ||||
*Adjusted EBITDA Margin % | 9.1 | % | 1.6 | % | 6.6 | % | 1.2 | % | ||||||||
*Adjusted EBITDA is a Non-GAAP Performance Measure. Please see the attached table for a reconciliation of adjusted EBITDA to GAAP net loss. |
Second Quarter 2023 Results (compared with the prior-year period, unless noted otherwise)
Consolidated sales were up $45.3 million, or 35.1%, from the second quarter of 2022, and up 11.4% sequentially. Aerospace sales increased $49.1 million over the comparator quarter, or 44.9%, driven primarily by higher sales to the commercial transport market. Test Systems sales decreased $3.8 million on lower defense revenue.
Consolidated operating income was $2.4 million, an improvement over an operating loss of $8.4 million in the prior-year period. The current period operating income improvement was driven by the contribution margin from the increased sales. The current period was impacted by litigation-related legal expenses of $4.9 million partially offset by a reduction in legal reserves of $1.3 million.
Interest expense was $5.9 million in the current period, compared with $1.7 million in the prior-year period, primarily driven by higher interest rates on the Company’s new credit facilities. Interest expense includes approximately $0.7 million of non-cash amortization of capitalized financing-related fees.
Income tax expense was $8.1 million in the current period, primarily due to a valuation allowance applied against the deferred tax asset associated with research and development costs that are required to be capitalized for tax purposes.
Consolidated net loss was $12.0 million, or $0.37 per diluted share, compared with net loss of $11.0 million, or $0.34 per diluted share, in the prior year.
Consolidated adjusted EBITDA was $15.8 million, or 9.1% of consolidated sales, compared with an adjusted EBITDA of $2.1 million, or 1.6% of consolidated sales, in the prior-year period.
Bookings were $207.1 million in the quarter resulting in a book-to-bill ratio of 1.19:1. The quarter closed with a record backlog of $611.1 million. Approximately $502.0 million of backlog is expected to ship over the next twelve months.
Aerospace Segment Review(refer to sales by market and segment data in accompanying tables)
Aerospace Second Quarter 2023 Results (compared with the prior-year period, unless noted otherwise)
Aerospace segment sales increased $49.1 million, or 44.9%, to $158.4 million, and up 16.8% sequentially. The increase was driven by a 61.9% increase, or $42.8 million, in commercial transport sales. Sales to this market were $112.1 million, or 64.3% of consolidated sales in the quarter, compared with $69.2 million, or 53.6% of consolidated sales in the second quarter of 2022. Improving global airline travel driving higher fleet utilization and increased production rates resulted in increased demand.
General Aviation sales increased $6.9 million, or 38.0%, to $25.0 million.
Aerospace segment operating profit improved to $13.7 million, or 8.7% of sales, compared with operating loss of $3.3 million in the same period last year. The improved operating profit was driven by higher volume primarily in the commercial transport market.
Aerospace bookings were $188.8 million for a book-to-bill ratio of 1.19:1. Backlog for the Aerospace segment was a record $522.6 million at quarter end.
Mr. Gundermann commented, “The recovery in our Aerospace segment over the last four quarters has been dramatic, with revenue increasing from $112 million per quarter to $158 million. Bookings during that period have totaled $656 million with a book-to-bill of 1.21:1, indicating strong demand for our products and opportunity for further growth. The increase in global passenger travel is driving the recovery, resulting in higher production rates and retrofit activity across all portions of the industry.”
Test Systems Segment Review(refer to sales by market and segment data in accompanying tables)
Test Systems Second Quarter 2023 Results (compared with the prior-year period, unless noted otherwise)
Test Systems segment sales were $16.1 million, down $3.8 million primarily as a result of lower defense revenue.
Test Systems segment operating loss was $6.1 million compared with nearly break-even in the second quarter of 2022. Test Systems operating loss for the current period was negatively affected by mix, under absorption of fixed costs due to volume and $2.2 million in increased litigation-related legal expenses.
Shortly after the first quarter ended, the Test Systems segment implemented restructuring initiatives to align the workforce and management structure with near-term revenue expectations and operational needs. These initiatives are expected to provide savings of $4 million to $5 million annually, beginning with the third quarter.
Bookings for the Test Systems segment in the quarter were $18.3 million and included the initial $9.6 million production order for the Handheld Radio Test Sets (“HHRTS”) Program for the U.S. Marine Corps. Book-to-bill ratio was 1.14:1 for the quarter. Backlog was $88.5 million at the end of the second quarter of 2023 compared with backlog of $83.6 million at the end of the second quarter of 2022.
In April 2023, Astronics announced that the Test business had been awarded a contract award to produce portable radio test equipment for the U.S. Marine Corps’ HHRTS Program. This program is expected to generate revenue of approximately $40 million over a five-year period.
Mr. Gundermann commented, “Our Test business had a difficult quarter, with lower-than-expected revenue and high legal costs. We expect significant improvement in the coming quarters as our radio test programs advance, setting up 2024 as a much better year.”
Liquidity and Financing
Cash on hand at the end of the quarter was $4.3 million. Capital expenditures in the quarter were $2.2 million. Net debt was $178.7 million.
Cash used for operations was $2.0 million in second quarter of 2023, improving from cash used of $19.2 million in the prior quarter. Astronics expects to be cash flow positive for the remainder of 2023. During the quarter, higher inventory and accounts receivable were partially offset by increased accounts payable and accrued expenses.
David Burney, the Company’s CFO, said, “Our liquidity during the second quarter was tighter than expected as inventory levels continued to increase. We are challenged by elevated inventory levels as we forecast strong sales growth but struggle with the inefficiencies in the supply chain. We expect inventory levels to begin to decline and liquidity to improve as we move through the second half of the year.”
2023 Outlook
Revenue guidance for 2023 is unchanged at $640 million to $680 million with expectations of achieving the higher end of the range. Planned capital expenditures for 2023 are expected to be in the range of $7 million to $12 million.
Peter Gundermann commented, “We are pleased with the progress we made in the first half of 2023 and are confident about the second half as well. Demand remains strong, and our supply chain, though imperfect, continues to improve. We feel we have line of sight to the high end of our range based on existing backlog and the established momentum of our revenue ramp. Sales in the first half of the year were $331 million and we began the second half of 2023 with $330 million of scheduled backlog. With that, we expect our typical additional drop-in and pull-in orders could deliver revenue at the high end of our guidance. There’s modest risk with the supply chain and timing of major Test segment contract awards. We expect margins to continue to improve with expected increases in volume, lower cost inputs, pricing improvements, and the effects of restructuring activities accomplished in the second quarter. We also expect our year end to be busy with shipments and continued demand strength, setting up for another strong year of improvement in 2024.”
Second Quarter 2023 Webcast and Conference Call
The Company will host a teleconference today at 4:45 p.m. ET. During the teleconference, management will review the financial and operating results for the period and discuss Astronics’ corporate strategy and outlook. A question-and-answer session will follow.
The Astronics conference call can be accessed by calling (412) 317-5180. The listen-only audio webcast can be monitored at investors.astronics.com. To listen to the archived call, dial (412) 317-6671 and enter replay pin number 10180028. The telephonic replay will be available from 8:00 p.m. on the day of the call through Thursday, August 17, 2023. A transcript of the call will also be posted to the Company’s Web site once available.
About Astronics Corporation
Astronics Corporation (Nasdaq: ATRO) serves the world’s aerospace, defense, and other mission critical industries with proven, innovative technology solutions. Astronics works side-by-side with customers, integrating its array of power, connectivity, lighting, structures, interiors, and test technologies to solve complex challenges. For over 50 years, Astronics has delivered creative, customer-focused solutions with exceptional responsiveness. Today, global airframe manufacturers, airlines, military branches, completion centers, and Fortune 500 companies rely on the collaborative spirit and innovation of Astronics. The Company’s strategy is to increase its value by developing technologies and capabilities that provide innovative solutions to its targeted markets.
Safe Harbor Statement
This news release contains forward-looking statements as defined by the Securities Exchange Act of 1934. One can identify these forward-looking statements by the use of the words “expect,” “anticipate,” “plan,” “may,” “will,” “estimate” or other similar expressions and include all statements with regard to achieving any revenue or profitability expectations, the rate of recovery of the commercial aerospace widebody/long haul markets, the improvement in the supply chain and reduction of spot buys, the timing of pricing and impact of inflation on margins, the effectiveness on profitability of cost reduction efforts, the timing of receipt of task orders or future orders, and the expectations of demand by customers and markets. Because such statements apply to future events, they are subject to risks and uncertainties that could cause actual results to differ materially from those contemplated by the statements. Important factors that could cause actual results to differ materially from what may be stated here include the continued global impact of COVID-19 and related governmental and other actions taken in response, trend in growth with passenger power and connectivity on airplanes, the state of the aerospace and defense industries, the market acceptance of newly developed products, internal production capabilities, the timing of orders received, the status of customer certification processes and delivery schedules, the demand for and market acceptance of new or existing aircraft which contain the Company’s products, the need for new and advanced test and simulation equipment, customer preferences and relationships, the effectiveness of the Company’s supply chain, and other factors which are described in filings by Astronics with the Securities and Exchange Commission. The Company assumes no obligation to update forward-looking information in this news release whether to reflect changed assumptions, the occurrence of unanticipated events or changes in future operating results, financial conditions or prospects, or otherwise.
FINANCIAL TABLES FOLLOW
ASTRONICS CORPORATION | ||||||||||||
CONSOLIDATED STATEMENT OF OPERATIONS DATA | ||||||||||||
(Unaudited, $ in thousands except per share data) | ||||||||||||
Three Months Ended | Six Months Ended | |||||||||||
7/1/2023 | 7/2/2022 | 7/1/2023 | 7/2/2022 | |||||||||
Sales 1 | $ | 174,454 | $ | 129,127 | $ | 330,992 | $ | 245,303 | ||||
Cost of products sold 2 | 141,759 | 113,418 | 270,787 | 209,661 | ||||||||
Gross profit | 32,695 | 15,709 | 60,205 | 35,642 | ||||||||
Gross margin | 18.7 | % | 12.2 | % | 18.2 | % | 14.5 | % | ||||
Selling, general and administrative | 30,299 | 24,105 | 60,179 | 48,205 | ||||||||
SG&A % of sales | 17.4 | % | 18.7 | % | 18.2 | % | 19.7 | % | ||||
Income (loss) from operations | 2,396 | (8,396 | ) | 26 | (12,563 | ) | ||||||
Operating margin | 1.4 | % | (6.5 | )% | — | % | (5.1 | )% | ||||
Net gain on sale of business 3 | — | — | (3,427 | ) | (11,284 | ) | ||||||
Other expense (income) 4 | 378 | 291 | (910 | ) | 753 | |||||||
Interest expense, net | 5,920 | 1,662 | 11,390 | 3,293 | ||||||||
Loss before tax | (3,902 | ) | (10,349 | ) | (7,027 | ) | (5,325 | ) | ||||
Income tax expense | 8,097 | 661 | 9,387 | 8,786 | ||||||||
Net loss | $ | (11,999 | ) | $ | (11,010 | ) | $ | (16,414 | ) | $ | (14,111 | ) |
Net loss % of sales | (6.9 | )% | (8.5 | )% | (5.0 | )% | (5.8 | )% | ||||
*Basic loss per share: | $ | (0.37 | ) | $ | (0.34 | ) | $ | (0.50 | ) | $ | (0.44 | ) |
*Diluted loss per share: | $ | (0.37 | ) | $ | (0.34 | ) | $ | (0.50 | ) | $ | (0.44 | ) |
*Weighted average diluted shares outstanding (in thousands) | 32,614 | 32,082 | 32,560 | 32,007 | ||||||||
Capital expenditures | $ | 2,233 | $ | 1,333 | $ | 3,806 | $ | 2,493 | ||||
Depreciation and amortization | $ | 6,711 | $ | 7,000 | $ | 13,373 | $ | 14,088 |
| _______________________________ |
| 1 In the six months ended July 1, 2023, $5.8 million was recognized in sales related to the reversal of a deferred revenue liability recorded with a previous acquisition within our Test Systems Segment. |
| 2 In the six months ended July 2, 2022, $6.0 million of the Aviation Manufacturing Jobs Protection Program grant was recognized as an offset to cost of products sold. |
| 3 Net gain on sale of business for the six months ended July 1, 2023 and July 2, 2022 is comprised of the additional gain on the sale of the Company’s former semiconductor test business resulting from the contingent earnout for the 2022 and 2021 calendar year, respectively. |
| 4 Other expense (income) for the six months ended July 1, 2023 includes income of $1.8 million associated with the reversal of a liability related to an equity investment, as we will no longer be required to make the associated payment. |
ASTRONICS CORPORATION | ||||||||||||
SEGMENT DATA | ||||||||||||
(Unaudited, $ in thousands) | ||||||||||||
Three Months Ended | Six Months Ended | |||||||||||
7/1/2023 | 7/2/2022 | 7/1/2023 | 7/2/2022 | |||||||||
Sales | ||||||||||||
Aerospace | $ | 158,386 | $ | 109,300 | $ | 294,101 | $ | 210,694 | ||||
Less inter-segment | (4 | ) | (10 | ) | (122 | ) | (10 | ) | ||||
Total Aerospace | 158,382 | 109,290 | 293,979 | 210,684 | ||||||||
Test Systems 1 | 16,072 | 19,840 | 37,013 | 34,638 | ||||||||
Less inter-segment | — | (3 | ) | — | (19 | ) | ||||||
Total Test Systems | 16,072 | 19,837 | 37,013 | 34,619 | ||||||||
Total consolidated sales | 174,454 | 129,127 | 330,992 | 245,303 | ||||||||
Segment operating profit (loss) and margins | ||||||||||||
Aerospace 2 | 13,719 | (3,276 | ) | 17,806 | (226 | ) | ||||||
8.7 | % | (3.0 | )% | 6.1 | % | (0.1 | )% | |||||
Test Systems 1 | (6,143 | ) | (26 | ) | (6,740 | ) | (1,813 | ) | ||||
(38.2 | )% | (0.1 | )% | (18.2 | )% | (5.2 | )% | |||||
Total segment operating profit (loss) | 7,576 | (3,302 | ) | 11,066 | (2,039 | ) | ||||||
Net gain on sale of business | — | — | (3,427 | ) | (11,284 | ) | ||||||
Interest expense | 5,920 | 1,662 | 11,390 | 3,293 | ||||||||
Corporate expenses and other 3 | 5,558 | 5,385 | 10,130 | 11,277 | ||||||||
Loss before taxes | $ | (3,902 | ) | $ | (10,349 | ) | $ | (7,027 | ) | $ | (5,325 | ) |
| ________________________________ |
| 1 In the six months ended July 1, 2023, $5.8 million was recognized in sales related to the reversal of a deferred revenue liability recorded with a previous acquisition within our Test Systems Segment, which also benefits operating loss for the period. Absent that benefit, Test Systems operating loss was $12.6 million. |
| 2 In the six months ended July 2, 2022, $6.0 million of the Aviation Manufacturing Jobs Protection Program grant was recognized as an offset to the cost of products sold in the Aerospace segment. |
| 3 Corporate expenses and other for the six months ended July 1, 2023 includes income of $1.8 million associated with the reversal of a liability related to an equity investment, as we will no longer be required to make the associated payment. |
Reconciliation to Non-GAAP Performance Measures
In addition to reporting net income, a U.S. generally accepted accounting principle (“GAAP”) measure, we present Adjusted EBITDA (earnings before interest, income taxes, depreciation and amortization, non-cash equity-based compensation expense, goodwill, intangible and long-lived asset impairment charges, equity investment income or loss, legal reserves, settlements and recoveries, restructuring charges, gains or losses associated with the sale of businesses and grant benefits recorded related to the AMJP program), which is a non-GAAP measure. The Company’s management believes Adjusted EBITDA is an important measure of operating performance because it allows management, investors and others to evaluate and compare the performance of its core operations from period to period by removing the impact of the capital structure (interest), tangible and intangible asset base (depreciation and amortization), taxes, equity-based compensation expense, goodwill, intangible and long-lived asset impairment charges, equity investment income or loss, legal reserves, settlements and recoveries, litigation-related expenses, restructuring charges, gains or losses associated with the sale of businesses and grant benefits recorded related to the AMJP program, which is not commensurate with the core activities of the reporting period in which it is included. As such, the Company uses Adjusted EBITDA as a measure of performance when evaluating its business and as a basis for planning and forecasting. Adjusted EBITDA is not a measure of financial performance under GAAP and is not calculated through the application of GAAP. As such, it should not be considered as a substitute for the GAAP measure of net income and, therefore, should not be used in isolation of, but in conjunction with, the GAAP measure. Adjusted EBITDA, as presented, may produce results that vary from the GAAP measure and may not be comparable to a similarly defined non-GAAP measure used by other companies.
ASTRONICS CORPORATION | ||||||||||||
RECONCILIATION OF NET LOSS TO ADJUSTED EBITDA | ||||||||||||
(Unaudited, $ in thousands) | ||||||||||||
Consolidated | ||||||||||||
Three Months Ended | Six Months Ended | |||||||||||
7/1/2023 | 7/2/2022 | 7/1/2023 | 7/2/2022 | |||||||||
Net loss | $ | (11,999 | ) | $ | (11,010 | ) | $ | (16,414 | ) | $ | (14,111 | ) |
Add back (deduct): | ||||||||||||
Interest expense | 5,920 | 1,662 | 11,390 | 3,293 | ||||||||
Income tax expense | 8,097 | 661 | 9,387 | 8,786 | ||||||||
Depreciation and amortization expense | 6,711 | 7,000 | 13,373 | 14,088 | ||||||||
Equity-based compensation expense | 1,593 | 1,620 | 3,992 | 3,721 | ||||||||
Restructuring-related charges including severance | 564 | 90 | 564 | 174 | ||||||||
Legal reserve, settlements and recoveries | (1,305 | ) | — | (1,305 | ) | — | ||||||
Non-cash accrued 401K contribution | 1,328 | 1,186 | 2,536 | 2,197 | ||||||||
Litigation-related legal expenses | 4,935 | 872 | 9,450 | 2,174 | ||||||||
Equity investment accrued payable write-off | — | — | (1,800 | ) | — | |||||||
AMJP grant benefit | — | — | — | (6,008 | ) | |||||||
Net gain on sale of business | — | — | (3,427 | ) | (11,284 | ) | ||||||
Deferred liability recovery | — | — | (5,824 | ) | — | |||||||
Adjusted EBITDA | $ | 15,844 | $ | 2,081 | $ | 21,922 | $ | 3,030 | ||||
Sales | $ | 174,454 | $ | 129,127 | $ | 330,992 | $ | 245,303 | ||||
Adjusted EBITDA margin on sales | 9.1 | % | 1.6 | % | 6.6 | % | 1.2 | % |
ASTRONICS CORPORATION | ||||
CONSOLIDATED BALANCE SHEET DATA | ||||
($ in thousands) | ||||
(unaudited) | ||||
7/1/2023 | 12/31/2022 | |||
ASSETS | ||||
Cash and cash equivalents | $ | 3,472 | $ | 13,778 |
Restricted cash | 822 | — | ||
Accounts receivable and uncompleted contracts | 170,806 | 147,790 | ||
Inventories | 207,446 | 187,983 | ||
Other current assets | 15,650 | 15,743 | ||
Property, plant and equipment, net | 87,800 | 90,658 | ||
Other long-term assets | 37,274 | 21,633 | ||
Intangible assets, net | 72,108 | 79,277 | ||
Goodwill | 58,210 | 58,169 | ||
Total assets | $ | 653,588 | $ | 615,031 |
LIABILITIES AND SHAREHOLDERS' EQUITY | ||||
Current maturities of long-term debt | $ | 8,960 | $ | 4,500 |
Accounts payable and accrued expenses | 137,920 | 114,545 | ||
Customer advances and deferred revenue | 27,288 | 32,567 | ||
Long-term debt | 168,733 | 159,500 | ||
Other liabilities | 80,286 | 63,999 | ||
Shareholders' equity | 230,401 | 239,920 | ||
Total liabilities and shareholders' equity | $ | 653,588 | $ | 615,031 |
ASTRONICS CORPORATION | ||||||
CONSOLIDATED CASH FLOWS DATA | ||||||
Six Months Ended | ||||||
(Unaudited, $ in thousands) | 7/1/2023 | 7/2/2022 | ||||
Cash flows from operating activities: | ||||||
Net loss | $ | (16,414 | ) | $ | (14,111 | ) |
Adjustments to reconcile net loss to cash from operating activities: | ||||||
Non-cash items: | ||||||
Depreciation and amortization | 13,373 | 14,088 | ||||
Amortization of deferred financing fees | 1,363 | — | ||||
Provisions for non-cash losses on inventory and receivables | 1,705 | 677 | ||||
Equity-based compensation expense | 3,992 | 3,721 | ||||
Net gain on sale of business | (3,427 | ) | (11,284 | ) | ||
Operating lease non-cash expense | 2,563 | 2,928 | ||||
Non-cash 401K contribution accrual | 2,536 | 2,197 | ||||
Non-cash deferred liability reversal | (5,824 | ) | — | |||
Other | (1,275 | ) | 1,320 | |||
Cash flows from changes in operating assets and liabilities: | ||||||
Accounts receivable | (22,619 | ) | (11,449 | ) | ||
Inventories | (22,638 | ) | (19,293 | ) | ||
Prepaid expenses and other current assets | 472 | (3,030 | ) | |||
Accounts payable | 14,081 | 11,660 | ||||
Accrued expenses | 5,460 | (458 | ) | |||
Income taxes payable/receivable | 7,422 | 16,909 | ||||
Operating lease liabilities | (2,674 | ) | (3,601 | ) | ||
Customer advance payments and deferred revenue | 959 | (389 | ) | |||
Supplemental retirement plan and other liabilities | (206 | ) | (215 | ) | ||
Net cash from operating activities | (21,151 | ) | (10,330 | ) | ||
Cash flows from investing activities: | ||||||
Proceeds on sale of business and assets | 3,427 | 21,977 | ||||
Capital expenditures | (3,806 | ) | (2,493 | ) | ||
Net cash from investing activities | (379 | ) | 19,484 | |||
Cash flows from financing activities: | ||||||
Proceeds from long-term debt | 131,732 | 52,625 | ||||
Principal payments on long-term debt | (112,774 | ) | (79,625 | ) | ||
Stock award and employee stock purchase plan activity | (601 | ) | 104 | |||
Finance lease principal payments | (24 | ) | (55 | ) | ||
Financing-related costs | (6,388 | ) | (771 | ) | ||
Net cash from financing activities | 11,945 | (27,722 | ) | |||
Effect of exchange rates on cash | 101 | (505 | ) | |||
Decrease in cash and cash equivalents and restricted cash | (9,484 | ) | (19,073 | ) | ||
Cash and cash equivalents and restricted cash at beginning of period | 13,778 | 29,757 | ||||
Cash and cash equivalents and restricted cash at end of period | $ | 4,294 | $ | 10,684 |
ASTRONICS CORPORATION | ||||||||||||||
SALES BY MARKET | ||||||||||||||
(Unaudited, $ in thousands) | ||||||||||||||
Three Months Ended | Six Months Ended | 2023 YTD | ||||||||||||
7/1/2023 | 7/2/2022 | % Change | 7/1/2023 | 7/2/2022 | % Change | % of Sales | ||||||||
Aerospace Segment | ||||||||||||||
Commercial Transport | $ | 112,079 | $ | 69,243 | 61.9 | % | $ | 206,292 | $ | 133,332 | 54.7 | % | 62.3 | % |
Military Aircraft | 13,584 | 13,897 | (2.3 | )% | 27,648 | 28,873 | (4.2 | )% | 8.4 | % | ||||
General Aviation | 25,015 | 18,130 | 38.0 | % | 44,463 | 33,997 | 30.8 | % | 13.4 | % | ||||
Other | 7,704 | 8,020 | (3.9 | )% | 15,576 | 14,482 | 7.6 | % | 4.7 | % | ||||
Aerospace Total | 158,382 | 109,290 | 44.9 | % | 293,979 | 210,684 | 39.5 | % | 88.8 | % | ||||
Test Systems Segment 1 | ||||||||||||||
Government & Defense | 16,072 | 19,837 | (19.0 | )% | 37,013 | 34,619 | 6.9 | % | 11.2 | % | ||||
Total Sales | $ | 174,454 | $ | 129,127 | 35.1 | % | $ | 330,992 | $ | 245,303 | 34.9 | % |
SALES BY PRODUCT LINE | ||||||||||||||
(Unaudited, $ in thousands) | ||||||||||||||
Three Months Ended | Six Months Ended | 2023 YTD | ||||||||||||
7/1/2023 | 7/2/2022 | % Change | 7/1/2023 | 7/2/2022 | % Change | % of Sales | ||||||||
Aerospace Segment | ||||||||||||||
Electrical Power & Motion | $ | 67,946 | $ | 42,135 | 61.3 | % | $ | 121,400 | $ | 86,602 | 40.2 | % | 36.7 | % |
Lighting & Safety | 41,918 | 31,388 | 33.5 | % | 78,471 | 60,599 | 29.5 | % | 23.7 | % | ||||
Avionics | 30,923 | 24,406 | 26.7 | % | 60,664 | 43,281 | 40.2 | % | 18.3 | % | ||||
Systems Certification | 7,620 | 1,669 | 356.6 | % | 13,297 | 2,671 | 397.8 | % | 4.0 | % | ||||
Structures | 2,271 | 1,672 | 35.8 | % | 4,571 | 3,049 | 49.9 | % | 1.4 | % | ||||
Other | 7,704 | 8,020 | (3.9 | )% | 15,576 | 14,482 | 7.6 | % | 4.7 | % | ||||
Aerospace Total | 158,382 | 109,290 | 44.9 | % | 293,979 | 210,684 | 39.5 | % | 88.8 | % | ||||
Test Systems Segment 1 | 16,072 | 19,837 | (19.0 | )% | 37,013 | 34,619 | 6.9 | % | 11.2 | % | ||||
Total Sales | $ | 174,454 | $ | 129,127 | 35.1 | % | $ | 330,992 | $ | 245,303 | 34.9 | % |
| ________________________________ |
| 1 Test Systems sales in the six months ended July 1, 2023 included a $5.8 million reversal of a deferred revenue liability recorded with a previous acquisition. |
ASTRONICS CORPORATION | ||||||||||
ORDER AND BACKLOG TREND | ||||||||||
(Unaudited, $ in thousands) | ||||||||||
Q3 2022 | Q4 2022 | Q1 2023 | Q2 2023 | Trailing Twelve Months | ||||||
10/1/2022 | 12/31/2022 | 4/1/2023 | 7/1/2023 | 7/1/2023 | ||||||
Sales | ||||||||||
Aerospace | $ | 112,177 | $ | 138,335 | $ | 135,597 | $ | 158,382 | $ | 544,491 |
Test Systems 1 | 19,261 | 19,818 | 20,941 | 16,072 | 76,092 | |||||
Total Sales 1 | $ | 131,438 | $ | 158,153 | $ | 156,538 | $ | 174,454 | $ | 620,583 |
Bookings | ||||||||||
Aerospace | $ | 165,719 | $ | 151,688 | $ | 150,096 | $ | 188,800 | $ | 656,303 |
Test Systems | 18,433 | 30,707 | 7,740 | 18,252 | 75,132 | |||||
Total Bookings | $ | 184,152 | $ | 182,395 | $ | 157,836 | $ | 207,052 | $ | 731,435 |
Backlog | ||||||||||
Aerospace | $ | 464,307 | $ | 477,660 | $ | 492,159 | $ | 522,577 | ||
Test Systems | 82,807 | 93,696 | 86,319 | 88,499 | ||||||
Total Backlog | $ | 547,114 | $ | 571,356 | $ | 578,478 | $ | 611,076 | N/A | |
Book:Bill Ratio | ||||||||||
Aerospace | 1.48 | 1.10 | 1.11 | 1.19 | 1.21 | |||||
Test Systems 1 | 0.96 | 1.55 | 0.51 | 1.14 | 1.07 | |||||
Total Book:Bill 1 | 1.40 | 1.15 | 1.05 | 1.19 | 1.19 |
| ________________________________ |
| 1 In the first quarter of 2023, Test Systems and Total sales includes the $5.8 million reversal of a deferred revenue liability. The book:bill ratios have been calculated excluding the impact of that transaction. |
View source version on businesswire.com:https://www.businesswire.com/news/home/20230803576443/en/
CONTACT: For more information, contact:
Company:
David C. Burney, Chief Financial Officer
Phone: (716) 805-1599, ext. 159
Email:david.burney@astronics.com
Investor Relations:
Deborah K. Pawlowski, Kei Advisors LLC
Phone: (716) 843-3908
Email:dpawlowski@keiadvisors.com
KEYWORD: NEW YORK UNITED STATES NORTH AMERICA
INDUSTRY KEYWORD: AEROSPACE TECHNOLOGY MANUFACTURING OTHER TRANSPORT AIR TRANSPORT OTHER MANUFACTURING OTHER DEFENSE DEFENSE ENGINEERING ELECTRONIC DESIGN AUTOMATION
SOURCE: Astronics Corporation
Copyright Business Wire 2023.
PUB: 08/03/2023 04:15 PM/DISC: 08/03/2023 04:15 PM
http://www.businesswire.com/news/home/20230803576443/en