NEW YORK--(BUSINESS WIRE)--Jun 22, 2023--
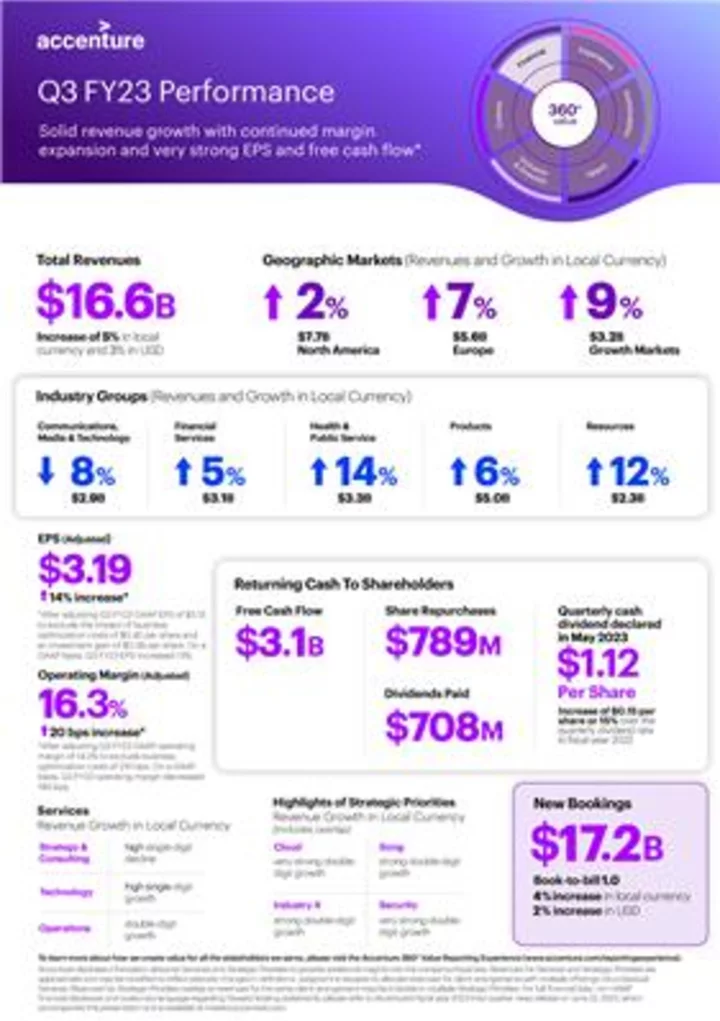
Accenture (NYSE: ACN) reported financial results for the third quarter of fiscal 2023, ended May 31, 2023, with revenues of $16.6 billion, an increase of 3% in U.S. dollars and 5% in local currency over the same period last year.
This press release features multimedia. View the full release here: https://www.businesswire.com/news/home/20230622087750/en/
3QFY23 Earnings Infographic (Graphic: Business Wire)
GAAP operating income was $2.36 billion, compared to $2.60 billion for the third quarter last year, and operating margin was 14.2% compared to 16.1% for the third quarter last year. Adjusted operating income was $2.71 billion and adjusted operating margin was 16.3%, an expansion of 20 basis points from the third quarter of fiscal 2022.
GAAP diluted earnings per share were $3.15, compared to $2.79 for the third quarter last year. Adjusted EPS were $3.19, an increase of 14% from the third quarter of fiscal 2022.
New bookings for the quarter were $17.2 billion, with consulting bookings of $8.9 billion and managed services bookings of $8.3 billion.
Julie Sweet, chair and CEO, Accenture, said, “Our third quarter results reflect solid bookings and revenue and very strong adjusted operating margin, earnings per share and free cash flow, which demonstrates the rigor and discipline with which we run our business. The strength of our strategy to be our clients’ transformation partner of choice continues to resonate, with 26 clients with quarterly bookings of $100 million or more; and our business model — which for decades has been built around the diversity of our markets, industries and services — along with our more than 730,000 talented people position us well to continue to deliver 360° value for our clients and stakeholders every day.”
1 Adjusted financial measures presented in this release are non-GAAP financial measures that exclude business optimization costs and a gain related to our investment in Duck Creek Technologies, as further described in this release. |
Financial Review
Revenues for the third quarter of fiscal 2023 were $16.56 billion, compared with $16.16 billion for the third quarter of fiscal 2022, an increase of 3% in U.S. dollars and 5% in local currency.
Revenues for the quarter reflect a foreign-exchange impact of approximately negative 2.5% compared with the negative 3.5% impact previously assumed. Adjusting for the actual foreign-exchange impact, the company’s guided range for quarterly revenues was approximately $16.25 billion to $16.85 billion. Accenture’s third quarter fiscal 2023 revenues were at the midpoint of this adjusted range.
- Consulting revenues for the quarter were $8.69 billion, a decrease of 4% in U.S. dollars and 1% in local currency compared with the third quarter of fiscal 2022.
- Managed Services revenues were $7.87 billion, an increase of 10% in U.S. dollars and 13% in local currency compared with the third quarter of fiscal 2022.
GAAP diluted EPS for the quarter were $3.15 compared with $2.79 for the third quarter of fiscal 2022. Excluding a $0.42 decrease for business optimization costs and $0.38 increase for a gain on an investment, adjusted EPS were $3.19, an increase of 14% from the third quarter of fiscal 2022. The $0.40 increase in EPS on an adjusted basis reflects:
- a $0.12 increase from higher revenue and operating results;
- a $0.15 increase from the loss on the disposition of the company’s business in Russia recorded in fiscal 2022;
- a $0.09 increase from a lower effective tax rate;
- a $0.04 increase from higher non-operating income; and
- a $0.01 increase from lower share count;
partially offset by
- a $0.01 decrease from higher noncontrolling interests.
Gross margin (gross profit as a percentage of revenues) for the quarter was 33.4% compared to 32.9% in the third quarter of fiscal 2022. Selling, general and administrative (SG&A) expenses for the quarter were $2.82 billion, or 17.0% of revenues, compared with $2.71 billion, or 16.8% of revenues, for the third quarter of fiscal 2022.
GAAP operating income for the quarter decreased 9%, to $2.36 billion, or 14.2% of revenues, compared with $2.60 billion, or 16.1% of revenues, for the third quarter of fiscal 2022. Adjusted operating income for the quarter was $2.71 billion, or 16.3% of revenues, an expansion of 20 basis points from the third quarter of fiscal 2022.
The company’s GAAP effective tax rate for the quarter was 22.2%, compared with 27.1% for the third quarter last year. On an adjusted basis, our effective tax rate for the third quarter of fiscal 2023 was 24.0%.
GAAP net income for the quarter was $2.05 billion, compared with $1.82 billion for the third quarter of fiscal 2022. Adjusted net income for the quarter was $2.07 billion.
Operating cash flow for the quarter was $3.29 billion, and property and equipment additions were $142 million. Free cash flow, defined as operating cash flow net of property and equipment additions, was $3.15 billion. For the same period last year, operating cash flow was $3.06 billion; property and equipment additions were $195 million; and free cash flow was $2.87 billion.
Days services outstanding, or DSOs, were 42 days at May 31, 2023, compared with 43 days at August 31, 2022 and 44 days at May 31, 2022.
Accenture’s total cash balance at May 31, 2023 was $8.5 billion, compared with $7.9 billion at August 31, 2022.
New Bookings
New bookings for the third quarter of fiscal 2023 were $17.25 billion, a 2% increase in U.S. dollars and a 4% increase in local currency over the third quarter of fiscal 2022.
- Consulting new bookings were $8.93 billion, or 52% of total new bookings.
- Managed Services new bookings were $8.32 billion, or 48% of total new bookings.
Revenues by Geographic Market
Revenues by geographic market were as follows:
- North America: $7.72 billion, an increase of 1% in U.S. dollars and in 2% local currency compared with the third quarter of fiscal 2022.
- Europe: $5.62 billion, an increase of 5% in U.S. dollars and 7% in local currency compared with the third quarter of fiscal 2022.
- Growth Markets: $3.23 billion, an increase of 1% in U.S. dollars and 9% in local currency compared with the third quarter of fiscal 2022.
Revenues by Industry Group
Revenues by industry group were as follows:
- Communications, Media & Technology: $2.88 billion, a decrease of 11% in U.S. dollars and 8% in local currency compared with the third quarter of fiscal 2022.
- Financial Services: $3.14 billion, an increase of 2% in U.S. dollars and 5% in local currency compared with the third quarter of fiscal 2022.
- Health & Public Service: $3.27 billion, an increase of 12% in U.S. dollars and 14% in local currency compared with the third quarter of fiscal 2022.
- Products: $4.97 billion, an increase of 3% in U.S. dollars and 6% in local currency compared with the third quarter of fiscal 2022.
- Resources: $2.31 billion, an increase of 8% in U.S. dollars and 12% in local currency compared with the third quarter of fiscal 2022.
Returning Cash to Shareholders
Accenture continues to return cash to shareholders through cash dividends and share repurchases.
Dividend
On May 15, 2023, a quarterly cash dividend of $1.12 per share was paid to shareholders of record at the close of business on April 13, 2023. These cash dividend payments totaled $708 million.
Accenture plc has declared another quarterly cash dividend of $1.12 per share for shareholders of record at the close of business on July 13, 2023. This dividend, which is payable on August 15, 2023, represents a 15% increase over the quarterly dividend rate of $0.97 per share in fiscal 2022.
Share Repurchase Activity
During the third quarter of fiscal 2023, Accenture repurchased or redeemed 2.8 million shares for a total of $789 million, including approximately 2.6 million shares repurchased in the open market. This brings Accenture’s total share repurchases and redemptions for the first three quarters of fiscal 2023 to 12.1 million shares for a total of $3.33 billion, including approximately 9.6 million shares repurchased in the open market.
Accenture’s total remaining share repurchase authority at May 31, 2023 was approximately $3.5 billion.
At May 31, 2023, Accenture had approximately 631 million total shares outstanding.
Business Outlook
Fourth Quarter Fiscal 2023
Accenture expects revenues for the fourth quarter of fiscal 2023 to be in the range of $15.75 billion to $16.35 billion, an increase of 2% to 6% in local currency, reflecting the company’s assumption of a flat foreign-exchange impact compared with the fourth quarter of fiscal 2022.
Fiscal Year 2023
Accenture’s business outlook for fiscal 2023 now assumes that the foreign-exchange impact on its results in U.S. dollars will be approximately negative 4% compared with fiscal 2022; the company previously expected a negative 4.5% foreign-exchange impact.
For fiscal 2023, the company now expects revenue growth to be in the range of 8% to 9% in local currency, compared to 8% to 10% previously.
Accenture now expects GAAP operating margin for fiscal 2023 to be 14.2% compared to a range of 14.1% to 14.3% previously, and adjusted operating margin, which excludes an estimated $800 million for business optimization costs, to be 15.4%, an expansion of 20 basis points from fiscal 2022. The company previously expected adjusted operating margin to be in the range of 15.3% to 15.5%.
The company now expects its GAAP annual effective tax rate to be in the range of 23.0% to 24.0%, compared to 22.5% to 24.5% previously, and its adjusted annual effective tax rate, which excludes the tax impacts of business optimization costs and a gain on an investment, to be in the range of 23.5% to 24.5%. The company previously expected its adjusted annual effective tax rate to be in the range of 23% to 25%.
The company now expects GAAP diluted EPS to be in the range of $10.94 to $11.05, compared to $10.84 to $11.06 previously, and adjusted EPS to be in the range of $11.52 to $11.63, an increase of 8% to 9% over fiscal 2022 diluted EPS of $10.71. This excludes $0.96 for business optimization costs and $0.38 for a gain on an investment. The company previously expected adjusted EPS to be in the range of $11.41 to $11.63.
For fiscal 2023, the company continues to expect operating cash flow to be in the range of $8.7 billion to $9.2 billion; now expects property and equipment additions to be $600 million, compared to $700 million previously; and now expects free cash flow to be in the range of $8.1 billion to $8.6 billion, compared to $8.0 billion and $8.5 billion previously.
The company continues to expect to return at least $7.1 billion in cash to shareholders through dividends and share repurchases.
360° Value Reporting
Accenture’s goal is to create 360° value for our clients, people, shareholders, partners, and communities. Our reporting captures how we deliver unique value across six vital dimensions and offers a comprehensive view of our financial and environmental, social and governance (ESG) measures, and our goals, progress and performance for each. Our full 360° Value Report and online 360° Value Reporting Experience provide customizable reporting. To access please visit the Accenture 360° Value Reporting Experience at www.accenture.com/reportingexperience.
Conference Call and Webcast Details
Accenture will host a conference call at 8:00 a.m. EDT today to discuss its third quarter of fiscal 2023 financial results. To participate, please dial +1 (877) 692-8955 [+1 (234) 720-6979 outside the United States, Puerto Rico and Canada] and enter access code 3264013 approximately 15 minutes before the scheduled start of the call. The conference call will also be accessible live on the Investor Relations section of the Accenture website at www.accenture.com.
A replay of the conference call will be available at www.accenture.com beginning at 11:00 a.m. EDT today, June 22, and continuing through September 27, 2023. The replay will also be available via telephone by dialing +1 (866) 207-1041 [+1 (402) 970-0847 outside the United States, Puerto Rico and Canada] and entering access code 4564655 from 11:00 a.m. EDT today, June 22, through Wednesday, September 27, 2023.
About Accenture
Accenture is a leading global professional services company that helps the world’s leading businesses, governments and other organizations build their digital core, optimize their operations, accelerate revenue growth and enhance citizen services—creating tangible value at speed and scale. We are a talent and innovation led company with 732,000 people serving clients in more than 120 countries. Technology is at the core of change today, and we are one of the world’s leaders in helping drive that change, with strong ecosystem relationships. We combine our strength in technology with unmatched industry experience, functional expertise and global delivery capability. We are uniquely able to deliver tangible outcomes because of our broad range of services, solutions and assets across Strategy & Consulting, Technology, Operations, Industry X and Accenture Song. These capabilities, together with our culture of shared success and commitment to creating 360° value, enable us to help our clients succeed and build trusted, lasting relationships. We measure our success by the 360° value we create for our clients, each other, our shareholders, partners and communities. Visit us at www.accenture.com.
Non-GAAP Financial Information
This news release includes certain non-GAAP financial information as defined by Securities and Exchange Commission Regulation G. Pursuant to the requirements of this regulation, reconciliations of this non-GAAP financial information to Accenture’s financial statements as prepared under generally accepted accounting principles (GAAP) are included in this press release. Financial results “in local currency” are calculated by restating current-period activity into U.S. dollars using the comparable prior-year period’s foreign-currency exchange rates. Accenture’s management believes providing investors with this information gives additional insights into Accenture’s results of operations. While Accenture’s management believes that the non-GAAP financial measures herein are useful in evaluating Accenture’s operations, this information should be considered as supplemental in nature and not as a substitute for the related financial information prepared in accordance with GAAP. Accenture provides full-year revenue guidance on a local-currency basis and not in U.S. dollars because the impact of foreign exchange rate fluctuations could vary significantly from the company’s stated assumptions.
Forward-Looking Statements
Except for the historical information and discussions contained herein, statements in this news release may constitute forward-looking statements within the meaning of the Private Securities Litigation Reform Act of 1995. Words such as “may,” “will,” “should,” “likely,” “anticipates,” “aspires,” “expects,” “intends,” “plans,” “projects,” “believes,” “estimates,” “positioned,” “outlook,” “goal,” “target,” and similar expressions are used to identify these forward-looking statements. These statements are not guarantees of future performance nor promises that goals or targets will be met, and involve a number of risks, uncertainties and other factors that are difficult to predict and could cause actual results to differ materially from those expressed or implied. These risks include, without limitation, risks that: Accenture’s results of operations have been, and may in the future be, adversely affected by volatile, negative or uncertain economic and political conditions and the effects of these conditions on the company’s clients’ businesses and levels of business activity; Accenture’s business depends on generating and maintaining client demand for the company’s services and solutions including through the adaptation and expansion of its services and solutions in response to ongoing changes in technology and offerings, and a significant reduction in such demand or an inability to respond to the evolving technological environment could materially affect the company’s results of operations; if Accenture is unable to match people and their skills with client demand around the world and attract and retain professionals with strong leadership skills, the company’s business, the utilization rate of the company’s professionals and the company’s results of operations may be materially adversely affected; Accenture faces legal, reputational and financial risks from any failure to protect client and/or company data from security incidents or cyberattacks; the markets in which Accenture operates are highly competitive, and Accenture might not be able to compete effectively; Accenture’s ability to attract and retain business and employees may depend on its reputation in the marketplace; Accenture’s environmental, social and governance (ESG) commitments and disclosures may expose it to reputational risks and legal liability; if Accenture does not successfully manage and develop its relationships with key ecosystem partners or fails to anticipate and establish new alliances in new technologies, the company’s results of operations could be adversely affected; Accenture’s profitability could materially suffer if the company is unable to obtain favorable pricing for its services and solutions, if the company is unable to remain competitive, if its cost-management strategies are unsuccessful or if it experiences delivery inefficiencies or fail to satisfy certain agreed-upon targets or specific service levels; changes in Accenture’s level of taxes, as well as audits, investigations and tax proceedings, or changes in tax laws or in their interpretation or enforcement, could have a material adverse effect on the company’s effective tax rate, results of operations, cash flows and financial condition; Accenture’s results of operations could be materially adversely affected by fluctuations in foreign currency exchange rates; changes to accounting standards or in the estimates and assumptions Accenture makes in connection with the preparation of its consolidated financial statements could adversely affect its financial results; as a result of Accenture’s geographically diverse operations and strategy to continue to grow in key markets around the world, the company is more susceptible to certain risks; if Accenture is unable to manage the organizational challenges associated with its size, the company might be unable to achieve its business objectives; Accenture might not be successful at acquiring, investing in or integrating businesses, entering into joint ventures or divesting businesses; Accenture’s business could be materially adversely affected if the company incurs legal liability; Accenture’s global operations expose the company to numerous and sometimes conflicting legal and regulatory requirements; Accenture’s work with government clients exposes the company to additional risks inherent in the government contracting environment; if Accenture is unable to protect or enforce its intellectual property rights or if Accenture’s services or solutions infringe upon the intellectual property rights of others or the company loses its ability to utilize the intellectual property of others, its business could be adversely affected; Accenture may be subject to criticism and negative publicity related to its incorporation in Ireland; as well as the risks, uncertainties and other factors discussed under the “Risk Factors” heading in Accenture plc’s most recent Annual Report on Form 10-K and other documents filed with or furnished to the Securities and Exchange Commission. In addition, the timing and amount of costs related to our business optimization actions and the nature and extent of benefits realized from such actions are subject to uncertainties and other factors, including local country consultation processes and regulations, and may differ from our current expectations and estimates. Statements in this news release speak only as of the date they were made, and Accenture undertakes no duty to update any forward-looking statements made in this news release or to conform such statements to actual results or changes in Accenture’s expectations.
Accenture plc Consolidated Income Statements (In thousands of U.S. dollars, except share and per share amounts) (Unaudited) | ||||||||||||
Three Months Ended | Nine Months Ended | |||||||||||
May 31, 2023 | % of Revenues | May 31, 2022 | % of Revenues | May 31, 2023 | % of Revenues | May 31, 2022 | % of Revenues | |||||
REVENUES: | ||||||||||||
Revenues | $ | 16,564,585 | 100.0 % | $ | 16,158,803 | 100.0 % | $ | 48,126,545 | 100.0 % | $ | 46,170,649 | 100.0 % |
OPERATING EXPENSES: | ||||||||||||
Cost of services | 11,035,515 | 66.6 % | 10,844,069 | 67.1 % | 32,576,567 | 67.7 % | 31,415,167 | 68.0 % | ||||
Sales and marketing | 1,738,621 | 10.5 % | 1,660,919 | 10.3 % | 4,852,207 | 10.1 % | 4,530,158 | 9.8 % | ||||
General and administrative costs | 1,084,288 | 6.5 % | 1,050,697 | 6.5 % | 3,209,539 | 6.7 % | 3,126,332 | 6.8 % | ||||
Business optimization costs | 346,873 | 2.1 % | — | — % | 591,263 | 1.2 % | — | — % | ||||
Total operating expenses | 14,205,297 | 13,555,685 | 41,229,576 | 39,071,657 | ||||||||
OPERATING INCOME | 2,359,288 | 14.2 % | 2,603,118 | 16.1 % | 6,896,969 | 14.3 % | 7,098,992 | 15.4 % | ||||
Interest income | 81,818 | 8,727 | 176,782 | 22,046 | ||||||||
Interest expense | (11,208) | (12,050) | (30,122) | (34,449) | ||||||||
Other income (expense), net | 201,783 | (8,877) | 136,576 | (39,089) | ||||||||
Loss on disposition of Russia business | — | (96,294) | — | (96,294) | ||||||||
INCOME BEFORE INCOME TAXES | 2,631,681 | 15.9 % | 2,494,624 | 15.4 % | 7,180,205 | 14.9 % | 6,951,206 | 15.1 % | ||||
Income tax expense | 583,346 | 675,308 | 1,584,887 | 1,654,631 | ||||||||
NET INCOME | 2,048,335 | 12.4 % | 1,819,316 | 11.3 % | 5,595,318 | 11.6 % | 5,296,575 | 11.5 % | ||||
Net income attributable to noncontrolling interest in Accenture Canada Holdings Inc. | (2,101) | (1,902) | (5,790) | (5,578) | ||||||||
Net income attributable to noncontrolling interests – other (1) | (36,238) | (31,339) | (90,934) | (78,956) | ||||||||
NET INCOME ATTRIBUTABLE TO ACCENTURE PLC | $ | 2,009,996 | 12.1 % | $ | 1,786,075 | 11.1 % | $ | 5,498,594 | 11.4 % | $ | 5,212,041 | 11.3 % |
CALCULATION OF EARNINGS PER SHARE: | ||||||||||||
Net income attributable to Accenture plc | $ | 2,009,996 | $ | 1,786,075 | $ | 5,498,594 | $ | 5,212,041 | ||||
Net income attributable to noncontrolling interest in Accenture Canada Holdings Inc. (2) | 2,101 | 1,902 | 5,790 | 5,578 | ||||||||
Net income for diluted earnings per share calculation | $ | 2,012,097 | $ | 1,787,977 | $ | 5,504,384 | $ | 5,217,619 | ||||
EARNINGS PER SHARE: | ||||||||||||
Basic | $ | 3.18 | $ | 2.82 | $ | 8.72 | $ | 8.23 | ||||
Diluted | $ | 3.15 | $ | 2.79 | $ | 8.62 | $ | 8.11 | ||||
WEIGHTED AVERAGE SHARES: | ||||||||||||
Basic | 631,535,162 | 632,749,442 | 630,826,230 | 632,969,487 | ||||||||
Diluted | 638,743,434 | 641,004,741 | 638,404,751 | 643,692,440 | ||||||||
Cash dividends per share | $ | 1.12 | $ | 0.97 | $ | 3.36 | $ | 2.91 |
| (1) | Comprised primarily of noncontrolling interest attributable to the noncontrolling shareholders of Avanade, Inc. |
| (2) | Diluted earnings per share assumes the exchange of all Accenture Canada Holdings Inc. exchangeable shares for Accenture plc Class A ordinary shares on a one-for-one basis. The income effect does not take into account “Net income attributable to noncontrolling interests — other,” since those shares are not redeemable or exchangeable for Accenture plc Class A ordinary shares. |
| Accenture plc Summary of Revenues (In thousands of U.S. dollars) (Unaudited) | ||||||
Three Months Ended | Percent Increase U.S. Dollars | Percent Increase Local Currency | ||||
May 31, 2023 | May 31, 2022 | |||||
GEOGRAPHIC MARKETS | ||||||
North America | $ | 7,720,903 | $ | 7,613,629 | 1 % | 2 % |
Europe | 5,615,466 | 5,350,360 | 5 | 7 | ||
Growth Markets | 3,228,216 | 3,194,814 | 1 | 9 | ||
Total Revenues | $ | 16,564,585 | $ | 16,158,803 | 3 % | 5 % |
INDUSTRY GROUPS (1) | ||||||
Communications, Media & Technology | $ | 2,880,187 | $ | 3,222,525 | (11) % | (8) % |
Financial Services | 3,138,181 | 3,079,418 | 2 | 5 | ||
Health & Public Service | 3,266,347 | 2,917,028 | 12 | 14 | ||
Products | 4,968,399 | 4,806,180 | 3 | 6 | ||
Resources | 2,311,471 | 2,133,652 | 8 | 12 | ||
Total Revenues | $ | 16,564,585 | $ | 16,158,803 | 3 % | 5 % |
TYPE OF WORK | ||||||
Consulting | $ | 8,693,030 | $ | 9,032,484 | (4) % | (1) % |
Managed Services (2) | 7,871,555 | 7,126,319 | 10 | 13 | ||
Total Revenues | $ | 16,564,585 | $ | 16,158,803 | 3 % | 5 % |
Nine Months Ended | Percent Increase U.S. Dollars | Percent Increase Local Currency | ||||
May 31, 2023 | May 31, 2022 | |||||
GEOGRAPHIC MARKETS | ||||||
North America | $ | 22,741,597 | $ | 21,597,880 | 5 % | 6 % |
Europe | 15,987,685 | 15,460,313 | 3 | 12 | ||
Growth Markets | 9,397,263 | 9,112,456 | 3 | 14 | ||
Total Revenues | $ | 48,126,545 | $ | 46,170,649 | 4 % | 10 % |
INDUSTRY GROUPS (1) | ||||||
Communications, Media & Technology | $ | 8,745,192 | $ | 9,118,790 | (4) % | 1 % |
Financial Services | 9,104,444 | 8,869,296 | 3 | 9 | ||
Health & Public Service | 9,289,961 | 8,333,915 | 11 | 15 | ||
Products | 14,352,759 | 13,797,044 | 4 | 10 | ||
Resources | 6,634,189 | 6,051,604 | 10 | 16 | ||
Total Revenues | $ | 48,126,545 | $ | 46,170,649 | 4 % | 10 % |
TYPE OF WORK | ||||||
Consulting | $ | 25,416,160 | $ | 25,747,095 | (1) % | 4 % |
Managed Services (2) | 22,710,385 | 20,423,554 | 11 | 16 | ||
Total Revenues | $ | 48,126,545 | $ | 46,170,649 | 4 % | 10 % |
(1) | Effective June 1, 2022, we revised the reporting of our industry groups for the movement of Aerospace & Defense from Communications, Media & Technology to Products. Prior period amounts have been reclassified to conform with the current period presentation. |
(2) | Previously referred to as our outsourcing business. |
Accenture plc Operating Income by Geographic Market (In thousands of U.S. dollars) (Unaudited) | ||||||||
Three Months Ended | ||||||||
May 31, 2023 | May 31, 2022 | |||||||
Operating Income | Operating Margin | Operating Income | Operating Margin | Increase (Decrease) | ||||
North America | $ | 1,241,245 | 16 % | $ | 1,379,828 | 18 % | $ | (138,583) |
Europe | 631,547 | 11 | 693,512 | 13 | (61,965) | |||
Growth Markets | 486,496 | 15 | 529,778 | 17 | (43,282) | |||
Total Operating Income | $ | 2,359,288 | 14.2 % | $ | 2,603,118 | 16.1 % | $ | (243,830) |
Nine Months Ended | ||||||||
May 31, 2023 | May 31, 2022 | |||||||
Operating Income | Operating Margin | Operating Income | Operating Margin | Increase (Decrease) | ||||
North America | $ | 3,374,986 | 15 % | $ | 3,715,155 | 17 % | $ | (340,169) |
Europe | 1,895,180 | 12 | 1,969,997 | 13 | (74,817) | |||
Growth Markets | 1,626,803 | 17 | 1,413,840 | 16 | 212,963 | |||
Total Operating Income | $ | 6,896,969 | 14.3 % | $ | 7,098,992 | 15.4 % | $ | (202,023) |
Accenture plc Reconciliation of Operating Income (GAAP) to Operating Income As Adjusted (Non-GAAP) (In thousands of U.S. dollars) (Unaudited) | ||||||||||||
Three Months Ended | ||||||||||||
May 31, 2023 | May 31, 2022 | |||||||||||
As Reported | Business | Adjusted | Operating Margin | As Reported | Operating Margin (GAAP) | Increase | ||||||
North America | $ | 1,241,245 | $ | 96,349 | $ | 1,337,594 | 17 % | $ | 1,379,828 | 18 % | $ | (42,234) |
Europe | 631,547 | 166,463 | 798,010 | 14 | 693,512 | 13 | 104,498 | |||||
Growth Markets | 486,496 | 84,061 | 570,557 | 18 | 529,778 | 17 | 40,779 | |||||
Total Operating Income | $ | 2,359,288 | $ | 346,873 | $ | 2,706,161 | 16.3 % | $ | 2,603,118 | 16.1 % | $ | 103,043 |
Nine Months Ended | ||||||||||||
May 31, 2023 | May 31, 2022 | |||||||||||
As Reported | Business | Adjusted | Operating Margin | As Reported | Operating Margin (GAAP) | Increase | ||||||
North America | $ | 3,374,986 | $ | 273,329 | $ | 3,648,315 | 16 % | $ | 3,715,155 | 17 % | $ | (66,840) |
Europe | 1,895,180 | 206,840 | 2,102,020 | 13 | 1,969,997 | 13 | 132,023 | |||||
Growth Markets | 1,626,803 | 111,094 | 1,737,897 | 18 | 1,413,840 | 16 | 324,057 | |||||
Total Operating Income | $ | 6,896,969 | $ | 591,263 | $ | 7,488,232 | 15.6 % | $ | 7,098,992 | 15.4 % | $ | 389,240 |
(1) | Costs recorded in connection with our business optimization initiatives, primarily for employee severance. |
Accenture plc Reconciliation of Operating Income and Diluted Earnings Per Share, as Reported (GAAP), to Operating Income and Diluted Earnings Per Share, as Adjusted (Non-GAAP) (In thousands of U.S. dollars, except per share amounts) (Unaudited) | ||||||||||
Three Months Ended | ||||||||||
May 31, 2023 | May 31, 2022 | |||||||||
As Reported | Business | Investment | Adjusted | As Reported | ||||||
Operating Income | $ | 2,359,288 | $ | 346,873 | $ | — | $ | 2,706,161 | $ | 2,603,118 |
Operating Margin | 14.2 % | 2.1 % | — % | 16.3 % | 16.1 % | |||||
Income before income taxes | 2,631,681 | 346,873 | (252,920) | 2,725,634 | 2,494,624 | |||||
Income tax expense | 583,346 | 80,336 | (8,840) | 654,842 | 675,308 | |||||
Net Income | $ | 2,048,335 | $ | 266,537 | $ | (244,080) | $ | 2,070,792 | $ | 1,819,316 |
Effective tax rate | 22.2 % | 23.2 % | 3.5 % | 24.0 % | 27.1 % | |||||
Diluted earnings per share | $ | 3.15 | $ | 0.42 | $ | (0.38) | $ | 3.19 | $ | 2.79 |
Nine Months Ended | ||||||||||
May 31, 2023 | May 31, 2022 | |||||||||
As Reported | Business | Investment | Adjusted | As Reported | ||||||
Operating Income | $ | 6,896,969 | $ | 591,263 | $ | — | $ | 7,488,232 | $ | 7,098,992 |
Operating Margin | 14.3 % | 1.3 % | — % | 15.6 % | 15.4 % | |||||
Income before income taxes | 7,180,205 | 591,263 | (252,920) | 7,518,548 | 6,951,206 | |||||
Income tax expense | 1,584,887 | 131,851 | (8,840) | 1,707,898 | 1,654,631 | |||||
Net Income | $ | 5,595,318 | $ | 459,412 | $ | (244,080) | $ | 5,810,650 | $ | 5,296,575 |
Effective tax rate | 22.1 % | 22.3 % | 3.5 % | 22.7 % | 23.8 % | |||||
Diluted earnings per share | $ | 8.62 | $ | 0.72 | $ | (0.38) | $ | 8.96 | $ | 8.11 |
(1) | Costs recorded in connection with our business optimization initiatives, primarily for employee severance |
(2) | Represents gain related to our investment in Duck Creek Technologies. |
| Accenture plc Consolidated Balance Sheets (In thousands of U.S. dollars) | ||||
May 31, 2023 | August 31, 2022 | |||
ASSETS | (Unaudited) | |||
CURRENT ASSETS: | ||||
Cash and cash equivalents | $ | 8,535,446 | $ | 7,889,833 |
Short-term investments | 4,482 | 3,973 | ||
Receivables and contract assets | 12,582,660 | 11,776,775 | ||
Other current assets | 2,257,485 | 1,940,290 | ||
Total current assets | 23,380,073 | 21,610,871 | ||
NON-CURRENT ASSETS: | ||||
Contract assets | 66,432 | 46,844 | ||
Investments | 176,259 | 317,972 | ||
Property and equipment, net | 1,534,927 | 1,659,140 | ||
Lease assets | 2,743,382 | 3,018,535 | ||
Goodwill | 14,461,094 | 13,133,293 | ||
Other non-current assets | 7,766,108 | 7,476,735 | ||
Total non-current assets | 26,748,202 | 25,652,519 | ||
TOTAL ASSETS | $ | 50,128,275 | $ | 47,263,390 |
LIABILITIES AND SHAREHOLDERS’ EQUITY | ||||
CURRENT LIABILITIES: | ||||
Current portion of long-term debt and bank borrowings | $ | 10,389 | $ | 9,175 |
Accounts payable | 2,388,474 | 2,559,485 | ||
Deferred revenues | 5,101,692 | 4,478,048 | ||
Accrued payroll and related benefits | 6,632,448 | 7,611,794 | ||
Lease liabilities | 690,584 | 707,598 | ||
Other accrued liabilities | 2,268,941 | 2,157,396 | ||
Total current liabilities | 17,092,528 | 17,523,496 | ||
NON-CURRENT LIABILITIES: | ||||
Long-term debt | 43,865 | 45,893 | ||
Lease liabilities | 2,351,375 | 2,563,090 | ||
Other non-current liabilities | 4,578,578 | 4,383,823 | ||
Total non-current liabilities | 6,973,818 | 6,992,806 | ||
Total Accenture plc shareholders’ equity | 25,332,431 | 22,106,097 | ||
Noncontrolling interests | 729,498 | 640,991 | ||
Total shareholders’ equity | 26,061,929 | 22,747,088 | ||
TOTAL LIABILITIES AND SHAREHOLDERS’ EQUITY | $ | 50,128,275 | $ | 47,263,390 |
Accenture plc Consolidated Cash Flows Statements (In thousands of U.S. dollars) (Unaudited) | ||||||||
Three Months Ended | Nine Months Ended | |||||||
May 31, 2023 | May 31, 2022 | May 31, 2023 | May 31, 2022 | |||||
CASH FLOWS FROM OPERATING ACTIVITIES: | ||||||||
Net income | $ | 2,048,335 | $ | 1,819,316 | $ | 5,595,318 | $ | 5,296,575 |
Depreciation, amortization and other | 601,099 | 524,186 | 1,639,804 | 1,553,311 | ||||
Share-based compensation expense | 472,695 | 407,257 | 1,530,034 | 1,319,555 | ||||
Change in assets and liabilities/other, net | 167,242 | 313,896 | (2,650,276) | (2,418,422) | ||||
Net cash provided by (used in) operating activities | 3,289,371 | 3,064,655 | 6,114,880 | 5,751,019 | ||||
CASH FLOWS FROM INVESTING ACTIVITIES: | ||||||||
Purchases of property and equipment | (141,500) | (194,616) | (347,878) | (540,947) | ||||
Purchases of businesses and investments, net of cash acquired | (257,020) | (363,614) | (1,334,007) | (2,212,388) | ||||
Proceeds from the sale of businesses and investments, net of cash transferred | 400,238 | (111,660) | 418,113 | (108,099) | ||||
Other investing, net | 3,273 | 2,936 | 8,392 | 9,397 | ||||
Net cash provided by (used in) investing activities | 4,991 | (666,954) | (1,255,380) | (2,852,037) | ||||
CASH FLOWS FROM FINANCING ACTIVITIES: | ||||||||
Proceeds from issuance of ordinary shares | 537,016 | 497,974 | 1,344,637 | 1,199,851 | ||||
Purchases of shares | (788,937) | (972,171) | (3,325,850) | (3,510,891) | ||||
Cash dividends paid | (707,742) | (613,785) | (2,121,331) | (1,843,576) | ||||
Other financing, net | (13,161) | (15,457) | (62,481) | (54,998) | ||||
Net cash provided by (used in) financing activities | (972,824) | (1,103,439) | (4,165,025) | (4,209,614) | ||||
Effect of exchange rate changes on cash and cash equivalents | (24,879) | (56,810) | (48,862) | (153,974) | ||||
NET INCREASE (DECREASE) IN CASH AND CASH EQUIVALENTS | 2,296,659 | 1,237,452 | 645,613 | (1,464,606) | ||||
CASH AND CASH EQUIVALENTS, beginning of period | 6,238,787 | 5,466,116 | 7,889,833 | 8,168,174 | ||||
CASH AND CASH EQUIVALENTS, end of period | $ | 8,535,446 | $ | 6,703,568 | $ | 8,535,446 | $ | 6,703,568 |
View source version on businesswire.com:https://www.businesswire.com/news/home/20230622087750/en/
CONTACT: Rachel Frey
Accenture Media Relations
+1 917 452 4421
rachel.frey@accenture.comKatie O’Conor
Accenture Investor Relations
+1 973 301 3275
catherine.m.oconor@accenture.com
KEYWORD: UNITED STATES NORTH AMERICA NEW YORK
INDUSTRY KEYWORD: CONSULTING PROFESSIONAL SERVICES FINANCE
SOURCE: Accenture
Copyright Business Wire 2023.
PUB: 06/22/2023 06:44 AM/DISC: 06/22/2023 06:42 AM
http://www.businesswire.com/news/home/20230622087750/en